Dental Implants and Prosthetics Market Size, Trends, Outlook, by Product, Implant (Titanium, Zirconium) (Premium, Value, Discounted Implant) Prosthetics (Bridge, Crown, Veneer, Inlay & Onlay), End-user, Region, Key Companies – Global Forecast to 2030
Wissen Research analyses that the dental implants and prosthetics market is estimated at USD 11.5 billion in 2023 and is projected to reach USD 16.5 billion by 2030, expected to grow at a CAGR of 5.3% during the forecast period of 2024 to 2030.
Driving Factor: Innovation to drive implantology
Innovation is still a major motivator, especially in the totally tapered and immediate app areas. The market’s major companies are concentrating on innovation. Immediacy solutions, which enable implants to be inserted immediately following tooth extraction and/or prosthetic replacement immediately following implant insertion, are a major development in implantology. This means fewer trips to the dentist and a quicker time to teeth. In response to this trend, numerous improvements are being developed, including custom-made prosthetics, computerized workflow solutions, and tapered implants for enhanced primary stability.
Opportunity: Emergence of DSOs and clinics getting associated with DSOs
Dental practice owners use dental support organizations (SDOs), to handle the business, marketing, and administrative aspects of their practices. Clinical services for patients are not offered by DSOs. Licensed dentists administer and directly supervise the provision of all patient clinical services. Instead, DSOs focus on meeting the dental offices’ nonclinical and commercial support needs. DSOs let dental professionals to concentrate on providing patient care by handling the administrative and other nonclinical requirements of their operations.
Modernizing the dental experience is one of these DSO leaders’ main priorities. This can involve improvements like streamlining the online scheduling and new patient forms process for patients, integrating artificial intelligence (AI) for x-ray analysis, putting in place cloud-based dental practice management systems like Denticon, and automating revenue cycle management with tools that speed up eligibility checks, claims processing, and payment posting.
Challenge: Increasing Price and Inadequate Reimbursement
The market for prostheses and dental implants is expected to increase slowly throughout the forecast period due to rising costs and insufficient reimbursements. But in the near future, the issues with dental bridges resulting from tooth loss could pose even more of a threat to the market expansion for prosthetics and dental implants.
The dental implants & prosthetics market report offers information on the latest advancements in the industry, as well as product portfolio analysis, supply chain/value chain analysis, market share, and the effects of localized and domestic players. It also analyzes potential revenue opportunities and changes in market regulations, as well as market size, category market growth, application dominance, product approvals, product launches, geographic expansions, and technological innovations. For an Analyst Brief and other information on the prosthetics and dental implants market, get in touch with Wissen Research. Our staff can assist you in making well-informed decisions that will lead to market expansion.
Titanium implants accounted for the largest share of dental implants market by material
Based on materials, the dental implants market is segmented into titanium implants and zirconium implants. In 2023, the titanium implants segment accounted for the largest share of 94%. The large share of this segment is primarily because of higher market penetration owing to the features such as higher strength, rigidity, superior biocompatibility with the human body, better strain-bearing capacity, and cost-effectiveness.
Tapered dental implant dominated the dental implants market by material
Based on design, the dental implants market is segmented into tapered dental implants and parallel-walled dental implants. In 2023, the tapered dental implants segment accounted for the largest share of 87.5%. Tapered dental implants are ideal for immediate implant placement and are designed for narrow gaps with root proximity of adjacent teeth. In addition, these implants offer high primary stability (due to screw design) and less risk of label perforation (due to their reduced apical diameter in all directions).
Premium dental implants to dominate and register high growth rate during the forecast period
Based on price, the dental implants market is segmented into premium dental implants, value dental implants, and discounted dental implants. In 2023, the premium dental implants segment accounted for the largest share of 48%. Premium dental implants often utilize advance material like high-purity titanium or zirconia, leading to enhanced biocompatibility, reduced risk of allergic reactions, and improved bone integration. In addition to this, the rising disposable income in the developed as well as developing markets has increased the adoption of premium implant over value or discounted dental implant. These factors are attributed to the large share of premium dental implants in 2023.
Bridges segment to hold the largest share while dentures to register high growth
Based on product, the dental prosthetics market is segmented into bridges, crowns, dentures, veneers, and inlays & onlays. In 2023, the bridges segment accounted for the largest share of 34%. Bridges are made of material that closely resembles natural teeth, providing a seamless and aesthetically pleasing smile, thereby adopted highly resulting in the largest share of the segment.
Europe to dominate the dental implant market and Asia Pacific to register the highest growth.
Based on geography the dental implants & prosthetics market is segmented into five mail regions, namely, North America, Europe, Asia Pacific, Latin America, and Middle East and Africa. Europe accounted for the largest share of 36.6% in the dental implants & prosthetics market in 2023. The large share of the geographic segment can be attributed to the advanced dental healthcare infrastructure, high awareness and demand for dental aesthetics, significant investment in dental research and technology, aging population, strong regulatory framework, and higher disposable incomes.
Asia Pacific region on the other hand is expected to register the highest growth of 6.9% during the forecast period. Key factors boosting the growth in this region are increasing disposable income, rising awareness of dental health, growing dental tourism attracting patients from the western world, and government initiatives and support.
Prominent players in the dental prosthetics market are Institut Straumann AG (Switzerland), Dentsply Sirona Inc. (US), Envista Holdings Corporation (US), ZimView Inc. (US), BioHorizons (US), Implant Direct Corporation (US), OSSTEM IMPLANT CO., LTD. (South Korea), Bicon, LLC (US), AVINENT IMPLANT SYSTEM (Spain), Adin Dental Implant System Ltd. (Israel), 3M Company (US), BEGO GmbH & Co. KG (Germany), Southern Implant (South Africa), Alpha-Bio Tec (Israel), Dentium Co., Ltd. (South Korea), Megagen Implant Co., Ltd. (South Korea), Cortex Dental Implants (Israel), Swiss Dental Solutions (Switzerland), Thommen Medical AG (Switzerland), Keystone Dental, Inc. (US), SDI Dental Implant (Germany), Bioline Dental Implants (Germany), Keystone Dental Group (US)
Dental implants are artificial structures made of materials like titanium and zirconium that a dental surgeon insets into the jawbone of the patients in case of one or more missing tooth. Dental prosthetics are the devices used to covers teeth defects in dental disorders. Some of the most popular dental prosthetics include crowns, bridges, dentures, and veneers
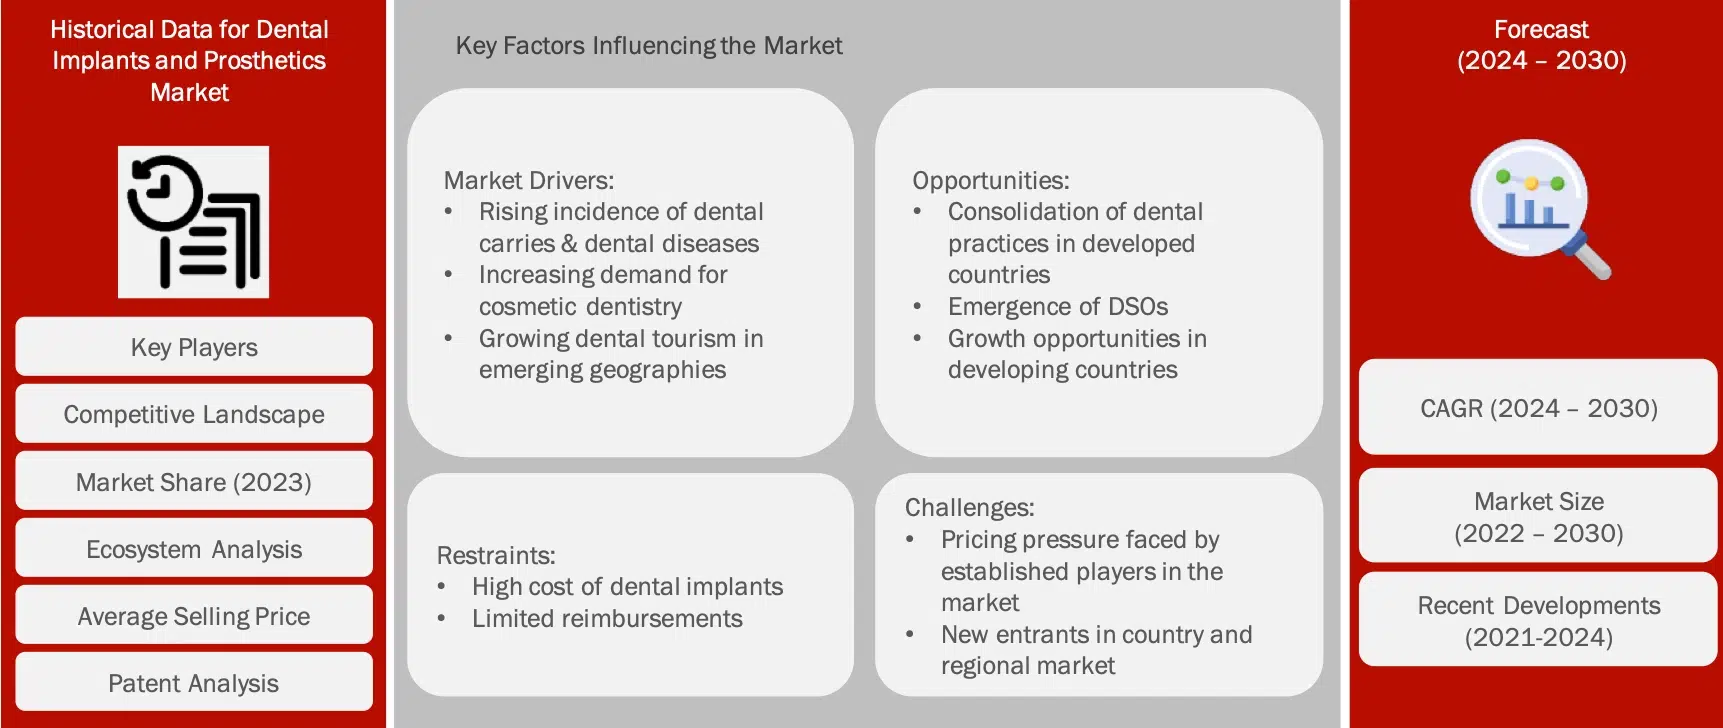
Report presents a detailed assessment of dental implants and prosthetics market and qualitative inputs and insights from WISSEN Research. The research study involved the extensive use of both primary and secondary sources. Various factors affecting the industry have been studies to identify segmentation types, industry trends, the competitive landscape of the market, and key market dynamics (such as drivers, restraints, opportunities, and challenges).
The following figure shows the market research methodology applied in this report of dental implants and prosthetics
SECONDARY DATA
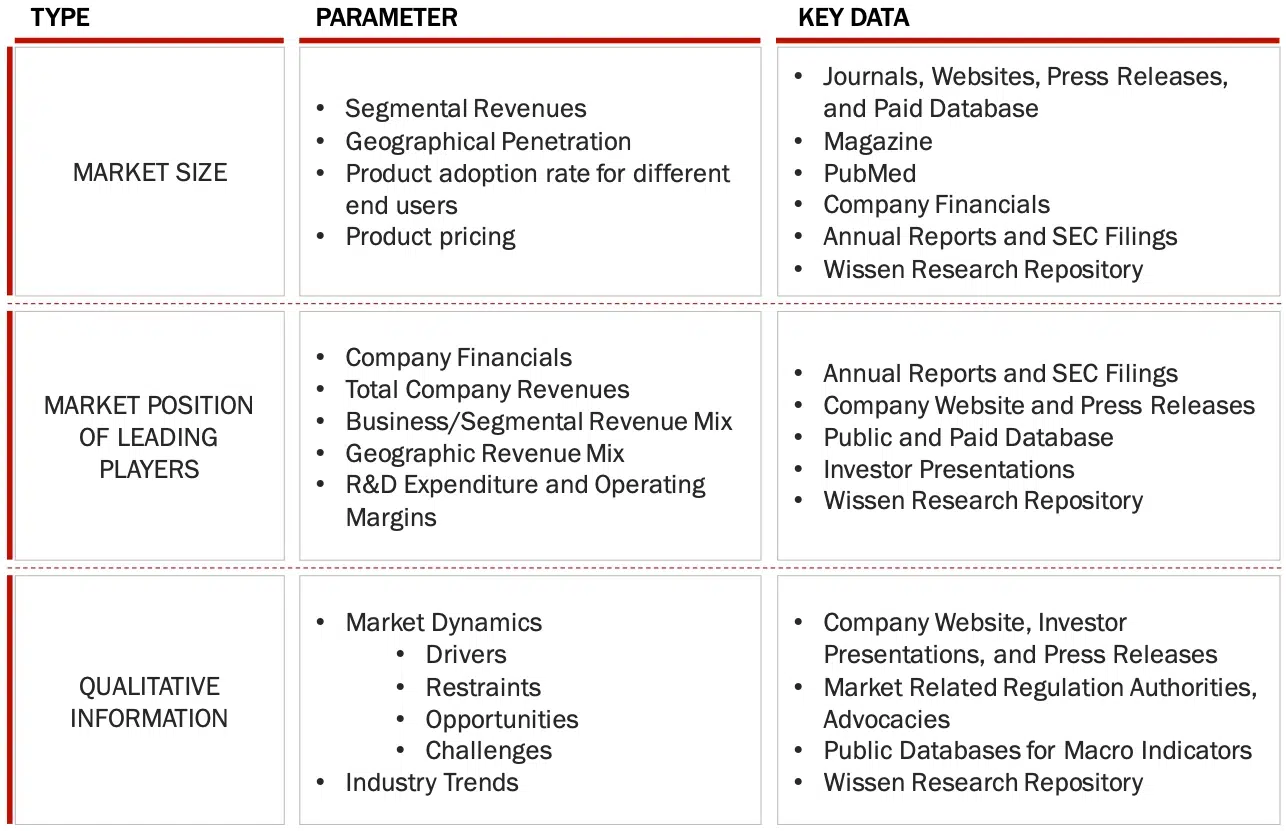
The research study involved various secondary sources, directories such as Bloomberg business, Factiva, and Wall Street Journals, white papers, annual reports, company house documents, investor presentation, and SEC filings of the companies.
The secondary research approach has been used to identify and collect information useful for the extensive, technical, market oriented and commercial study of the dental implants and prosthetics market. It was also used to obtain important information about key players, market classification, and segments according to industry trends and key developments related to the market perspectives. A database of the key industry leaders has also been prepared using secondary research. Some secondary sources referred are;
KEY DATA FROM SECONDARY SOURCES
PRIMARY DATA
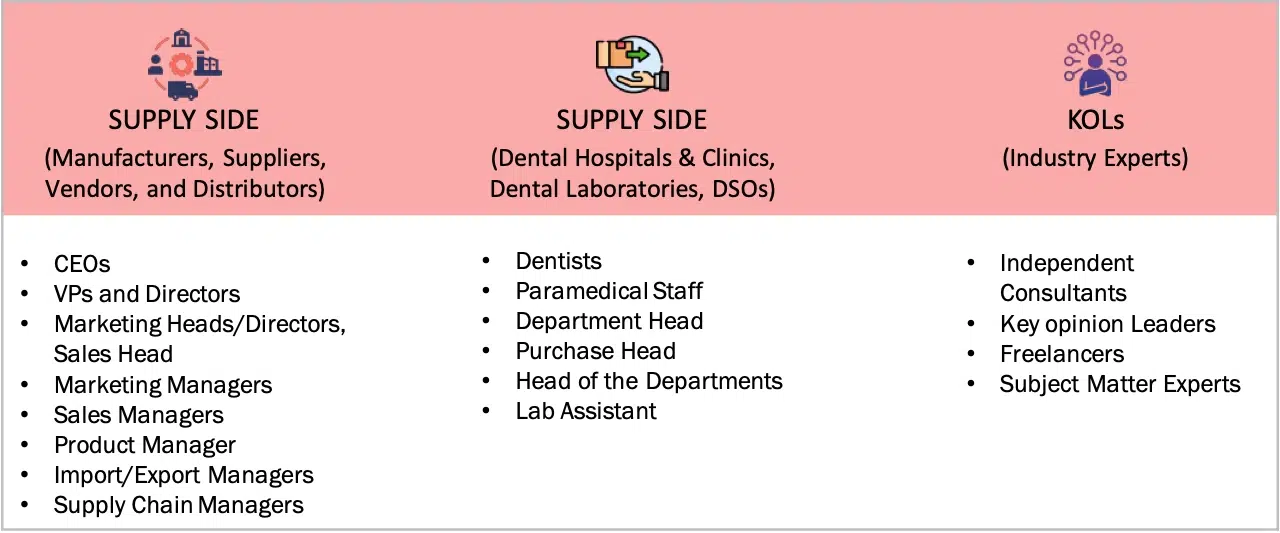
In primary market research approach, various sources from the supply and demand sides were interviewed to obtain qualitative and quantitative information for the report. Primary sources from the supply and demand side are listed below;
MARKET SIZE ESTIMATION
Total Market Size: Dental Implants and Prosthetics Market
The Total size of dental implants and prosthetics market was determined after data triangulation from four approaches as mentioned below. After each approach, the weighted average of all approaches was taken based on the level of assumptions used in each approach.
Approach 1: Supply Side analysis (Revenue Share Analysis)
The following figure shows the overall market size estimation process employed for this study;
SUPPLY SIDE MARKET SIZE ESTIMATION: REVENUE SHARE ANALYSIS

Sources: Annual report, SEC Filings, Company Websites, Press Releases, Investor Presentation, Primary Interviews, and Wissen Research Analysis
Report presents a detailed assessment of dental implants and prosthetics market and qualitative inputs and insights from WISSEN Research. The research study involved the extensive use of both primary and secondary sources. Various factors affecting the industry have been studies to identify segmentation types, industry trends, the competitive landscape of the market, and key market dynamics (such as drivers, restraints, opportunities, and challenges).
Approach 2: Investor Presentation and Primary interviews
SUPPLY SIDE MARKET SIZE ESTIMATION: COMPANY SHARE ANALYSIS
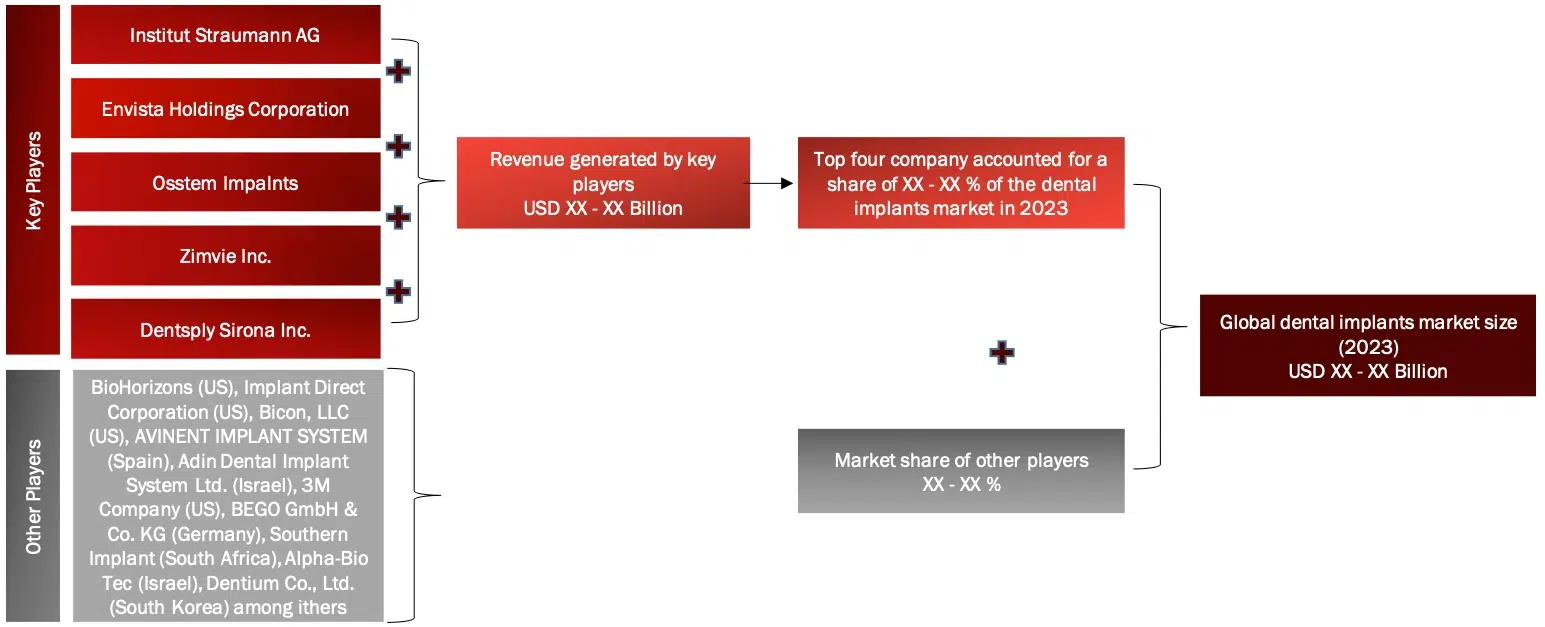
Sources: Annual report, SEC Filings, Company Websites, Press Releases, Investor Presentation, Primary Interviews, and Wissen Research Analysis
Approach 3 & 4: Bottom-up approach (Demand Side) and Top-down approach (Supply SIde)
Sources: Annual report, SEC Filings, Company Websites, Press Releases, Investor Presentation, Primary Interviews, and Wissen Research Analysis
Approach 1: geographical revenue contribution
Approach 2: Geographical adoption
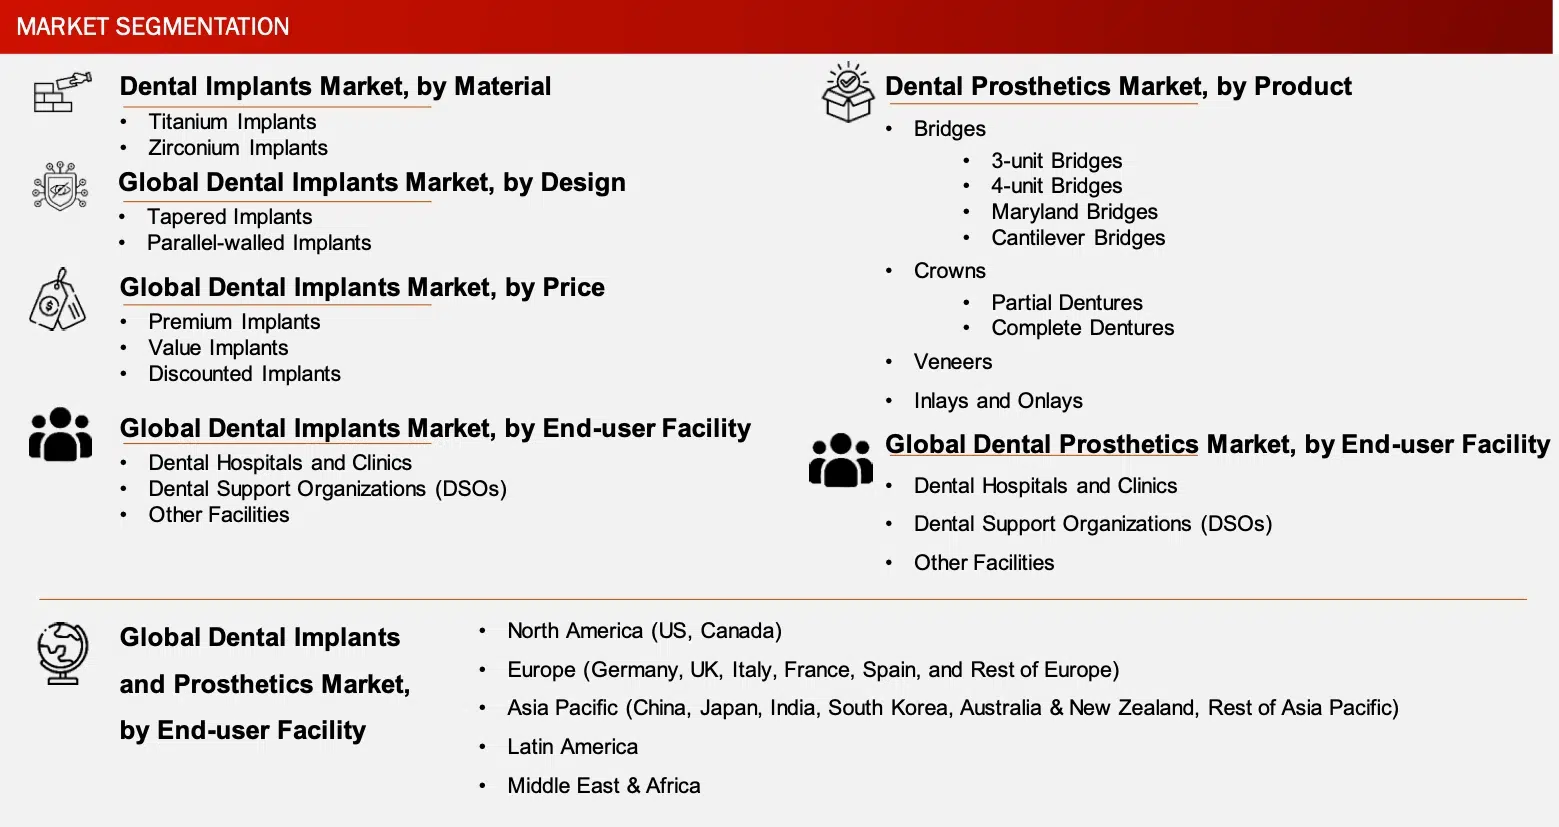
DENTAL IMPLANTS market BY MATERIAL, DESIGN, PRICE, END USER FACILITIES
By Product: Splits of the segments were derived by studying the type of material used to manufacture dental implants, product offerings by key players, and their adoption by the end users such as dental hospitals, clinics, DSOs, and other end users. The split shares and the segmental growth rates obtained from the secondary sources and Wissen Research analysis were further validated through expert interviews.
By Design: Splits of the segments were derived by studying the designs of the dental implants, product offerings by key players, and their adoption by the end users such as dental hospitals, clinics, DSOs, and other end users. The split shares and the segmental growth rates obtained from the secondary sources and Wissen Research analysis were further validated through expert interviews.
By Price: Splits of the segments were derived by studying various pricings for the dental implants – premium, value, and discounted prices. The split shares and the segmental growth rates obtained from the secondary sources and Wissen Research analysis were further validated through expert interviews.
By End User: For end users the spilt share of the segments was obtained by studying each end user and the type of dental implants adopted by then ad different levels such as material, price, and design. The split shares and the segmental growth rates obtained from the secondary sources and Wissen Research analysis were further validated through expert interviews.
CAGR PROJECTIONS FROM MARKET DYNAMICS ANALYSIS (2024-2030)
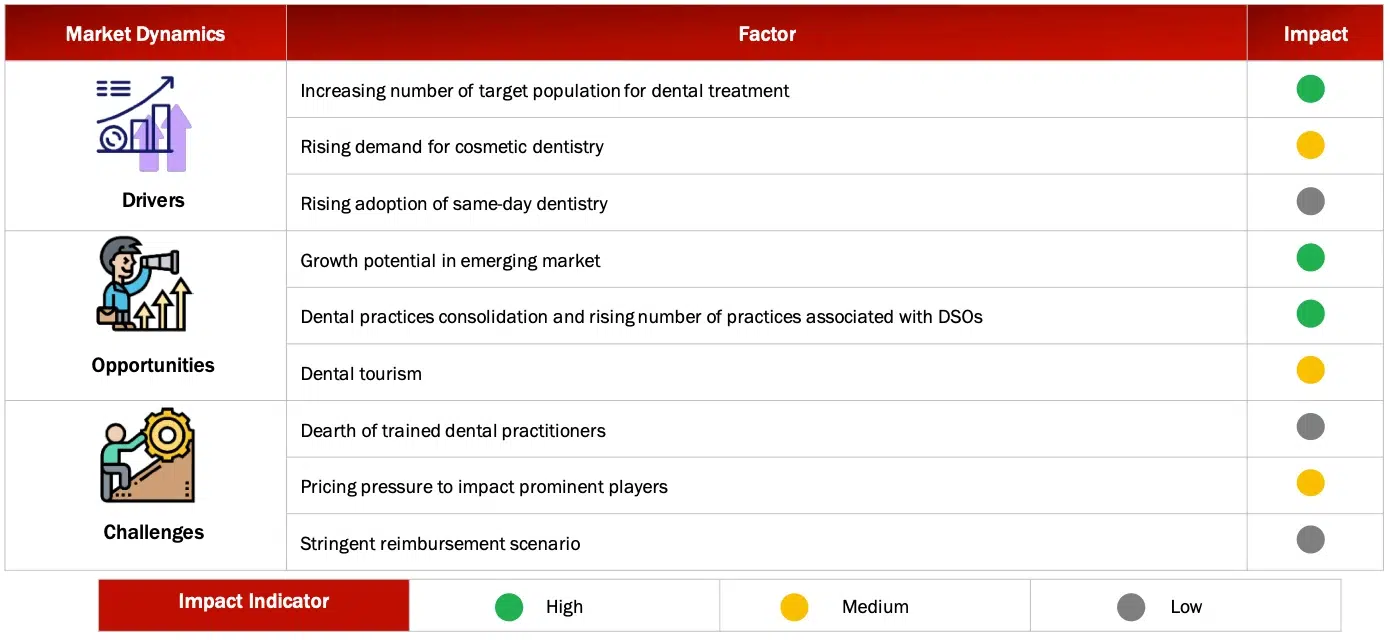
Sources: Annual report, SEC Filings, Company Websites, Press Releases, Investor Presentation, Primary Interviews, and Wissen Research Analysis
CAGR PROJECTIONS PARAMETERS (2024 – 2030)
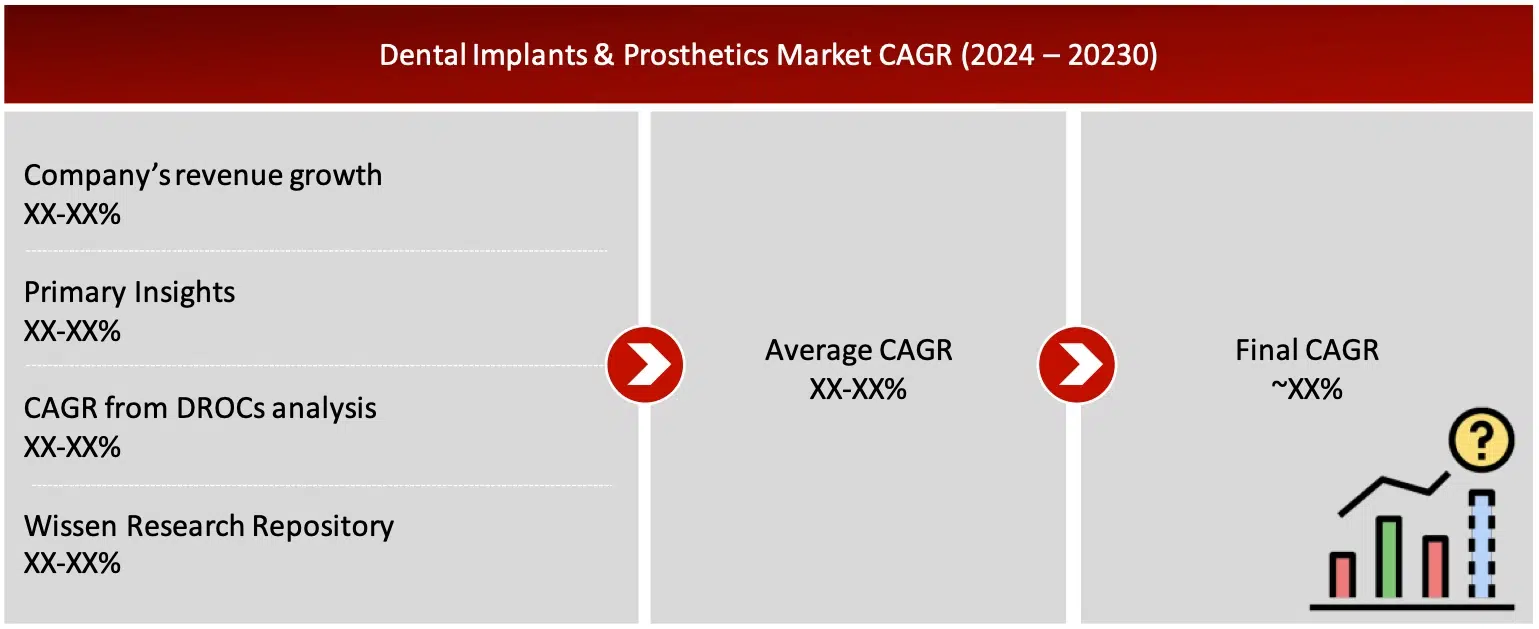
Sources: Annual report, SEC Filings, Company Websites, Press Releases, Investor Presentation, Primary Interviews, and Wissen Research Analysis
Market share estimation for segments in the dental implants and prosthetics market has been arrived at based on the secondary data available through paid and public sources and analysing the product portfolio of key players in the market by rating them based on performance and quality. The data has been further validated through expert interviews.
DATA TRIANGULATION AND MARKET BREAKDOWN
Data triangulation involved the combination of primary research, secondary research, and the Wissen Research Analysis. Once the data points are sourced from the secondary market research, we sanitize the data points to make the market sizing and growth forecast more accurate by developing our own assumptions based on the inputs and insights we gather through the primary interviews with the industry experts. Once the data is thoroughly validated through primary interviews from both, demand and supply side of the market, our team of analyst and other team members involved finalize the market sizing and growth forecast.
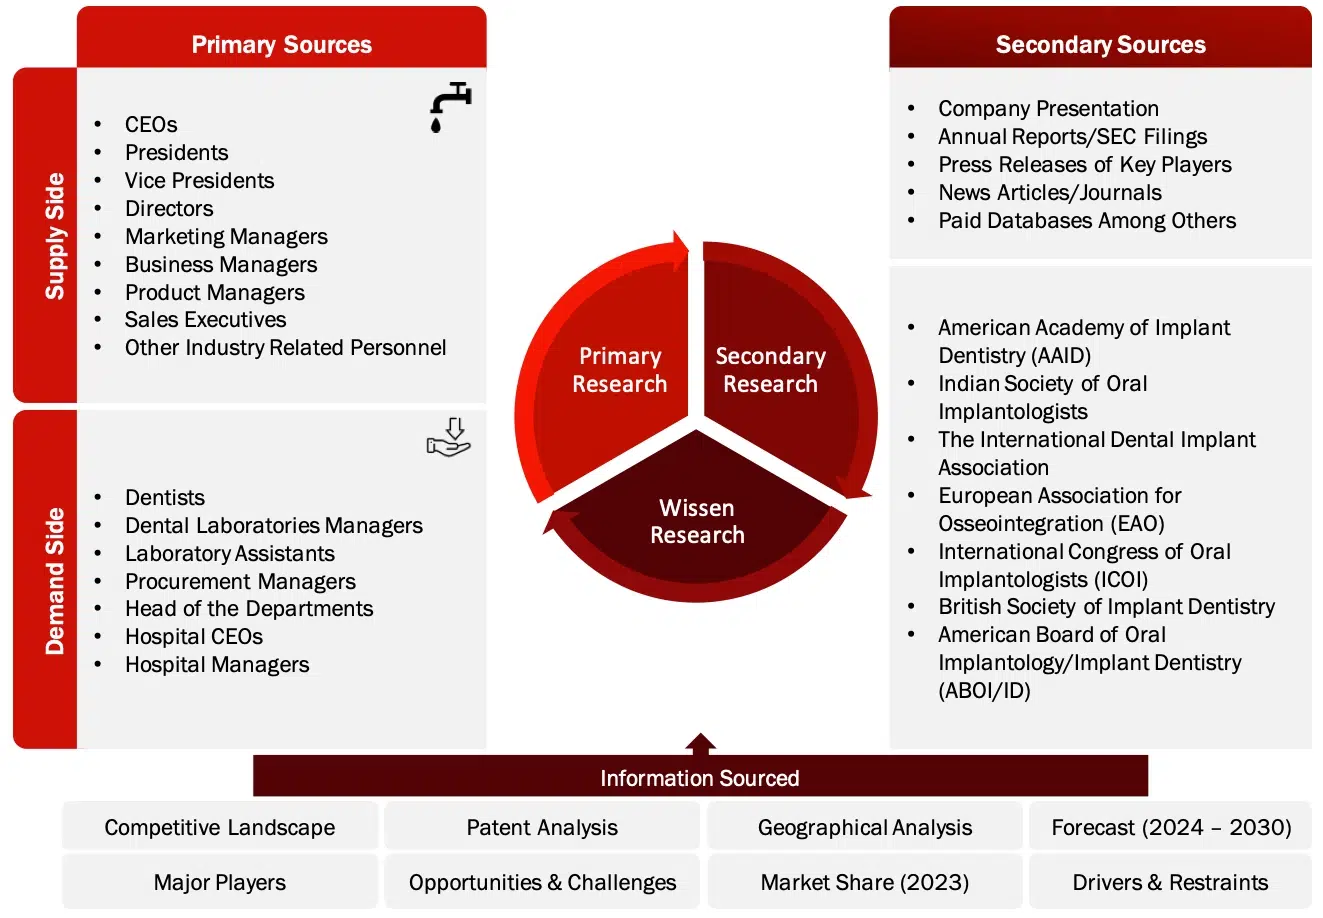
Sources: American Academy of Implant Dentistry (AAID), Indian Society of Oral Implantologists, The International Dental Implant Association, European Association for Osseointegration (EAO), International Congress of Oral Implantologists (ICOI), British Society of Implant Dentistry, American Board of Oral Implantology/Implant Dentistry (ABOI/ID), Implant Dentistry Research & Education Foundation (IDREF), American Society of Implant & Reconstructive Dentistry (ASIRD), Australian Society of Implant Dentistry (ASID), Company Website, Press Releases, Annual Reports, Paid Data Sources, and Wissen Research Analysis.
1. INTRODUCTION
1.1 MARKET DEFINITION
1.1.1 INCLUSIONS & EXCLUSIONS
1.2 KEY OBJECTIVES OF THE STUDY
1.3 SCOPE OF THE STUDY
1.3.1 MARKETS COVERED
1.4 KEY STAKEHOLDERS
1.5 CURRENCIES CONSIDERED
2. RESEARCH METHODOLOGY
2.1 RESEARCH DATA
2.1.1 KEY DATA FROM SECONDARY SOURCES
2.2 MARKET SIZE ESTIMATION
2.2.1 TOTAL MARKET SIZE: DENTAL IMPLANTS AND PROSTHETICS MARKET
2.2.2 GEOGRAPHICAL MARKET ASSESSMENT (BY REGION AND COUNTRY)
2.2.3 MARKET SEGMENT ASSESSMENT
2.2.4 GROWTH FORECAST
2.3 DATA TRIANGULATION AND MARKET BREAKDOWN
2.4 MARKET SHARE ESTIMATION
2.5 ASSUMPTIONS
2.6 LIMITATIONS
2.6.1 SCOPE-RELATED LIMITATIONS
2.6.2 METHODOLOGY-RELATED LIMITATIONS
2.7 RISK ASSESSMENT
3. EXECUTIVE SUMMARY AND PREMIUM CONTENT
3.1 ESECUTIVE SUMMARY
3.2 PREMIUM CONTENT
3.2.1 DENTAL IMPLANTS AND PROSTHETICS MARKET OVERVIEW
3.2.2 ASIA PACIFIC DENTAL IMPLANTS AND PROSTHETICS MARKET, BY PRODUCT AND COUNTRY (2023)
3.2.3 DENTAL IMPLANTS AND PROSTHETICS MARKET: REGIONAL GROWTH OPPORTUNITY
3.2.4 GEOGRAPHIC MIX: DENTAL IMPLANTS AND PROSTHETICS MARKET
3.2.5 DENTAL IMPLANTS AND PROSTHETICS MARKET: DEVELOPED VS EMERGING MARKETS
4. MARKET OVERVIEW
4.1 MARKET DYNAMICS
4.1.1 MARKET DRIVERS
4.1.1.1 RISING INCIDENCE OF DENTAL CARRIES AND DENTAL DISEASES
4.1.1.2 INCREASING AGING POPULATION
4.1.1.3 GROWING AWARENESS OF ORAL HEALTH
4.1.1.4 RISING DISPOSABLE INCOME
4.1.1.5 TECHNOLOGY ADVANCEMENTS
4.1.2 RESTRAINTS
4.1.2.1 HIGH COST OF DENTAL IMPLANT PROCEDURES
4.1.2.2 LACK OF INSURANCE AND LIMITED REIMBURSEMENT
4.1.2.3 SHORTAGE OF DENTAL PROFESSIONALS IN RURAL MARKET
4.1.3 OPPORTUNITIES
4.1.3.1 EXPANDING MARKET IN EMERGING ECONOMIES
4.1.3.2 INTEGRATION WITH DIGITAL DENTISTRY
4.1.4 CHALLENGES
4.1.4.1 MARKET SATURATION IN DEVELOPED REGIONS
4.1.4.2 SURGICAL RISK ASSOCIATED WITH DENTAL IMPLANTS AND PROSTHETICS PROCEDURES
4.2 TOP-LEVEL END USER PERCEPTION ANALYSIS
4.3 NEED-GAP ANALYSIS
4.4 VALUE CHAIN ANALYSIS
4.5 DENTAL IMPLANTS & PROSTHETICS MARKET: ECOSYSTEM
4.6 INDUSTRY TRENDS
4.6.1 INTEGRATION OF AUTOMATON AND ROBOTICS IN DENTAL IMPLANTOLOGY
4.6.2 EMERGENCE OF DENTAL SERVICE ORGANIZATIONS: A TREND IN DENTAL IMPLANTS MARKET
4.6.3 SAME-DAY DENTISTRY: A TREND SHIFTING THE DYNAMICS OF DENTAL IMPLANTS AND PROSTHETICS MARKET
4.7 PORTER’S FIVE FORCES MODEL
5. PATENT ANALYSIS
5.1 INTRODUCTION
5.2 DENTAL IMPLANTS AND PROSTHETICS MARKET: APPLICATION AND ISSUED TREND (2005 – 2024)
5.3 DENTAL IMPLANTS AND PROSTHETICS MARKET: PATENT ANALYSIS BY TYPE
5.4 DENTAL IMPLANTS AND PROSTHETICS MARKET: PATENT ANALYSIS BY COUNTRY OF ORIGIN
5.5 DENTAL IMPLANTS AND PROSTHETICS MARKET: TOP ASSIGNEES
5.6 DENTAL IMPLANTS AND PROSTHETICS MARKET: MOST CITED PATENTS
6. DENTAL IMPLANTS AND PROSTHETICS MARKET, BY PRODUCT
6.1 INTRODUCTION
6.2 DENTAL IMPLANTS
6.3 DENTAL PROSTHETICS
7. DENTAL IMPLANTS MARKET, BY MATERIAL
7.1 INTRODUCTION
7.2 TITANIUM DENTAL IMPLANTS
7.3 ZIRCONIUM DENTAL IMPLANTS
8. DENTAL IMPLANTS MARKET, BY DESIGN
8.1 INTRODUCTION
8.2 TAPERED DENTAL IMPLANTS
8.3 PARALLEL-WALLED DENTAL IMPLANTS
9. DENTAL IMPLANTS MARKET, BY PRICE
9.1 INTRODUCTION
9.2 PREMIUM DENTAL IMPLANTS
9.3 VALUE DENTAL IMPLANTS
9.4 DISCOUNTED DENTAL IMPLANTS
10. DENTAL PROSTHETICS MARKET, BY PRODUCT
10.1 INTRODUCTION
10.2 DENTAL BRIDGES
10.2.1 3-UNIT BRIDGES
10.2.2 4-UNIT BRIDGES
10.2.3 MARYLAND BRIDGES
10.2.4 CANTILEVER BRIDGES
10.3 DENTAL CROWNS
10.4 DENTURES
10.4.1 PARTIAL DENTURES
10.4.2 COMPLETE DENTURES
10.5 VENEERS
10.6 INLAYS & ONLAYS
11. DENTAL IMPLANTS AND PROSTHETICS MARKET, BY END USER FACILITIES
11.1 INTRODUCTION
11.2 DENTAL HOSPITALS & CLINICS
11.3 DENTAL SERVICE ORGANIZATIONS
11.4 OTHER END USER FACILITIES
12. DENTAL IMPLANTS AND PROSTHETICS MARKET, BY GEOGRAPHY
12.1 INTRODUCTION
12.2 NORTH AMERICA
12.2.1 US
12.2.2 CANADA
12.3 EUROPE
12.3.1 GERMANY
12.3.2 UK
12.3.3 FRANCE
12.3.4 ITALY
12.3.5 SPAIN
12.3.6 REST OF EUROPE
12.4 ASIA PACIFIC
12.4.1 CHINA
12.4.2 JAPAN
12.4.3 INDIA
12.4.4 SOUTH KOREA
12.4.5 AUSTRALIA & NEW ZEALAND
12.4.6 REST OF ASIA PACIFIC
12.5 LATIN AMERICA
12.6 MIDDLE EAST & AFRICA
13. COMPANY PROFILES
13.1 INSTITUT STRAUMANN AG
13.1.1 BUSINESS OVERVIEW
13.1.2 FINANCIAL SNAPSHOT: INSTITUT STRAUMANN AG (2023)
13.1.3 PRODUCT OFFERINGS
13.1.4 RECENT DEVELOPMENTS
13.2 DENTSPLY SIRONA, INC.
13.2.1 BUSINESS OVERVIEW
13.2.2 FINANCIAL SNAPSHOT: DENTSPLY SIRONA, INC. (2023)
13.2.3 PRODUCT OFFERINGS
13.2.4 RECENT DEVELOPMENTS
13.3 ENVISTA HOLDINGS CORPORATION
13.3.1 BUSINESS OVERVIEW
13.3.2 FINANCIAL SNAPSHOT: ENVISTA HOLDINGS CORPORATION (2023)
13.3.3 PRODUCT OFFERINGS
13.3.4 RECENT DEVELOPMENTS
13.4 ZIMVIE INC.
13.4.1 BUSINESS OVERVIEW
13.4.2 FINANCIAL SNAPSHOT: ZIMVIE INC. (2023)
13.4.3 PRODUCT OFFERINGS
13.4.4 RECENT DEVELOPMENTS
13.5 BIOHORIZONS
13.5.1 BUSINESS OVERVIEW
13.5.2 PRODUCT OFFERINGS
13.5.3 RECENT DEVELOPMENTS
13.6 OSSTEM IMPLANT CO., LTD.
13.6.1 BUSINESS OVERVIEW
13.6.2 FINANCIAL SNAPSHOT: OSSTEM IMPLANT CO., LTD. (2023)
13.6.3 PRODUCT OFFERINGS
13.6.4 RECENT DEVELOPMENTS
13.7 IMPLANT DIRECT CORPORATION
13.7.1 BUSINESS OVERVIEW
13.7.2 PRODUCT OFFERINGS
13.7.3 RECENT DEVELOPMENTS
13.8 BICON, LLC
13.8.1 BUSINESS OVERVIEW
13.8.2 PRODUCT OFFERINGS
13.8.3 RECENT DEVELOPMENTS
13.9 AVINENT IMPLANT SYSTEM
13.9.1 BUSINESS OVERVIEW
13.9.2 FINANCIAL SNAPSHOT: AVINENT IMPLANT SYSTEM (2023)
13.9.3 PRODUCT OFFERINGS
13.9.4 RECENT DEVELOPMENTS
13.10 ADIN DENTAL IMPLANT SYSTEM LTD.
13.10.1 BUSINESS OVERVIEW
13.10.2 PRODUCT OFFERINGS
13.11 3M COMPANY
13.11.1 BUSINESS OVERVIEW
13.11.2 FINANCIAL SNAPSHOT: 3M COMPANY (2023)
13.11.3 PRODUCT OFFERINGS
13.11.4 RECENT DEVELOPMENTS
13.12 BEGO GMBH & CO. KG
13.13 DIO CORPORATION
13.14 SOUTHERN IMPLANTS
13.15 IVOCLAR VIVADENT
13.16 ALPHA-BIO TEC
13.17 KEYSTONE DENTAL
14. COMPETITIVE LANDSCAPE
14.1 INTRODUCTION
14.2 MARKET SHARE ANALYSIS
14.3 COMPETITIVE SITUATION AND TRENDS
14.3.1 PRODUCT LAUNCHES
14.3.2 INORGANIC GROWTH STRATEGIES
14.4 KEY PLAYERS FOOTPRINT ANALYSIS
14.5 GEOGRAPHICAL REVENUE SNAPSHOT OF KEY PLAYERS
15. APPENDIX
15.1 INDUSTRY SPEAK: KEY INSIGHTS FROM PRIMARY INTERVIEWS
15.2 DISCUSSION GUIDE
15.2.1 MARKET OVERVIEW
15.2.2 MARKET SIZING AND SPLIT SHARES
15.2.3 COMPETITIVE LANDSCAPE
15.3 AVAILABLE CUSTOMIZATION OPTION
15.4 ADJACENT MARKET STUDIES
15.5 AUTHORS OF THE STUDY
LIST OF FIGURES
FIGURE 1: DENTAL IMPLANTS & PROSTHETICS MARKET SEGMENTATION
FIGURE 2: FIGURE1: RESEARCH DESIGN
FIGURE 3: PRIMARY SOURCES
FIGURE 4: PRIMARY PARTICIPANTS FROM DEMAND AND SUPPLY SIDE
FIGURE 5: BREAKDOWN OF PRIMARY PARTICIPANTS (SUPPLY SIDE)
FIGURE 6: BREAKDOWN OF PRIMARY PARTICIPANTS (DEMAND SIDE)
FIGURE 7: SUPPLY SIDE MARKET SIZE ESTIMATION: REVENUE SHARE ANALYSIS
FIGURE 8: REVENUE SHARE ANALYSIS ILLUSTRATION
FIGURE 9: SUPPLY SIDE MARKET SIZE ESTIMATION: COMPANY SHARE ANALYSIS
FIGURE 10: BOTTOM-UP APPROACH (DEMAND SIDE) AND TOP-DOWN APPROACH SUPPLY SIDE)
FIGURE 11: CAGR PROJECTIONS FROM MARKET DYNAMICS ANALYSIS (2024-2030)
FIGURE 12: CAGR PROJECTIONS PARAMETERS (2024 – 2030)
FIGURE 13: DATA TRIANGULATION METHODOLOGY
FIGURE 14: DENTAL IMPLANTS AND PROSTHETICS MARKET, BY PRODUCT (2024 VS 2030, USD MILLION)
FIGURE 15: DENTAL IMPLANTS MARKET, BY MATERIAL (2024 VS 2030, USD MILLION)
FIGURE 16: DENTAL IMPLANTS MARKET, BY DESIGN (2024 VS 2030, USD MILLION)
FIGURE 17: DENTAL IMPLANTS MARKET, BY PRICE (2024 VS 2030, USD MILLION)
FIGURE 18: DENTAL IMPLANTS AND PROSTHETICS MARKET, BY END USER FACILITY (2024 VS 2030, USD MILLION)
FIGURE 19: DENTAL PROSTHETICS MARKET, BY PRODUCT (2024 VS 2030, USD MILLION)
FIGURE 20: GEOGRAPHIC SNAPSHOT OF DENTAL IMPLANTS AND PROSTHETICS MARKET
FIGURE 21: RISING INCIDENCE OF DENTAL DISEASES TO DRIVE THE MARKET
FIGURE 22: CHINA ACCOUTED FOR THE LARGEST SHARE IN ASIA PACIFIC
FIGURE 23: CHINA AND INDIA TO REGISTER HIGHEST GROWTH DURING THE FORECAST PERIOD
FIGURE 24: EUROPE TO DOMINATE THE MARKET WHILE ASIA PAIFIC TO GROW AT HIGHEST CAGR THROUGH THE FORECAST PERIOD
FIGURE 25: EMERGING MARKETS TO REGISTER HIGHER GROWTH
FIGURE 26: PREVALENCE OF DENTAL CARRIES, BY COUNTRY (2023)
FIGURE 27: VALUE CHAIN ANALYSIS: KEY STAKEHOLDERS INVOLVED AT EACH STEP
FIGURE 28: GEOGRAPHICAL SNAPSHOT OF GLOBAL DENTAL IMPLANTS AND PROSTHETICS MARKET
FIGURE 29: NORTH AMERICA: REGIONAL SNAPSHOT – DENTAL IMPLANTS AND PROSTHETICS MARKET
FIGURE 30: EUROPE: REGIONAL SNAPSHOT – DENTAL IMPLANTS AND PROSTHETICS MARKET
FIGURE 31: ASIA PACIFIC: REGIONAL SNAPSHOT – DENTAL IMPLANTS AND PROSTHETICS MARKET
FIGURE 32: KEY STRATEGIES ADOPTED BY MAJOR PLAYERS IN DENTAL IMPLANTS AND PROSTHETICS MARKET (JANUARY 2021 – JULY 2024)
FIGURE 33: DENTAL IMPLANTS MARKET SHARE, BY KEY PLAYERS, 2023
TABLE 1: STANDARD CURRENCY COVERSION RATE
TABLE 2: ASSUMPTIONS OF THE STUDY
TABLE 3: RISK ASSESSMENT: DENTAL IMPLANTS MARKET
TABLE 4: POPULATION AGES 65 YEARS AND ABOVE (% OF TOTAL POPULATION)
TABLE 5: INCREASING DISPOSABLE INCOME (2020 -2023)
TABLE 6: AVERAGE COST OF SINGLE DENTAL IMPLANT PROCEDURE (USD)
TABLE 7: DENTAL IMPLANTS AND PROSTHETICS MARKET, BY PRODUCT (2022 – 2030, USD MILLION)
TABLE 8: DENTAL IMPLANTS MARKET, BY GEOGRAPHY (2022 – 2030, USD MILLION)
TABLE 9: DENTAL PROSTHETICS MARKET, BY GEOGRAPHY (2022 – 2030, USD MILLION)
TABLE 10: DENTAL IMPLANTS MARKET, BY MATERIAL (2022 – 2030, USD MILLION)
TABLE 11: EXAMPLES OF TITANIUM DENTAL IMPLANTS
TABLE 12: TITANIUM DENTAL IMPLANTS MARKET, BY GEOGRAPHY (2022 – 2030, USD MILLION)
TABLE 13: EXAMPLES OF ZIRCONIUM DENTAL IMPLANTS
TABLE 14: ZIRCONIUM DENTAL IMPLANTS MARKET, BY GEOGRAPHY (2022 – 2030, USD MILLION)
TABLE 15: DENTAL IMPLANTS MARKET, BY DESIGN (2022 – 2030, USD MILLION)
TABLE 16: EXAMPLES OF TAPERED DENTAL IMPLANTS
TABLE 17: TAPERED DENTAL IMPLANTS MARKET, BY GEOGRAPHY (2022 – 2030, USD MILLION)
TABLE 18: EXAMPLES OF PARALLEL-WALLED DENTAL IMPLANTS
TABLE 19: PARALLEL-WALLED DENTAL MARKET, BY GEOGRAPHY (2022 – 2030, USD MILLION)
TABLE 20: DENTAL IMPLANTS MARKET, BY PRICE (2022 – 2030, USD MILLION)
TABLE 21: EXAMPLES OF PREMIUM DENTAL IMPLANTS
TABLE 22: PREMIUM DENTAL IMPLANTS MARKET, BY GEOGRAPHY (2022 – 2030, USD MILLION)
TABLE 23: EXAMPLES OF VALUE DENTAL IMPLANTS
TABLE 24: VALUE DENTAL MARKET, BY GEOGRAPHY (2022 – 2030, USD MILLION)
TABLE 25: EXAMPLES OF DISCOUNTED DENTAL IMPLANTS
TABLE 26: DISCOUNTED DENTAL MARKET, BY GEOGRAPHY (2022 – 2030, USD MILLION)
TABLE 27: DENTAL PROSTHETICS MARKET, BY PRODUCT (2022 – 2030, USD MILLION)
TABLE 28: EXAMPLES OF DENTAL BRIDGES
TABLE 29: DENTAL BRIDGES MARKET, BY TYPE (2022 – 2030, USD MILLION)
TABLE 30: DENTAL BRIDGES MARKET, BY GEOGRAPHY (2022 – 2030, USD MILLION)
TABLE 31: 3-UNIT DENTAL BRIDGES MARKET, BY GEOGRAPHY (2022 – 2030, USD MILLION)
TABLE 32: 4-UNIT DENTAL BRIDGES MARKET, BY GEOGRAPHY (2022 – 2030, USD MILLION)
TABLE 33: MARYLAND DENTAL BRIDGES MARKET, BY GEOGRAPHY (2022 – 2030, USD MILLION)
TABLE 34: CANTILEVER DENTAL BRIDGES MARKET, BY GEOGRAPHY (2022 – 2030, USD MILLION)
TABLE 35: DENTAL CROWNS MARKET, BY GEOGRAPHY (2022 – 2030, USD MILLION)
TABLE 36: DENTURES MARKET, BY TYPE (2022 – 2030, USD MILLION)
TABLE 37: DENTURES MARKET, BY GEOGRAPHY (2022 – 2030, USD MILLION)
TABLE 38: PARTIAL DENTURES MARKET, BY GEOGRAPHY (2022 – 2030, USD MILLION)
TABLE 39: COMPLETE DENTURES MARKET, BY GEOGRAPHY (2022 – 2030, USD MILLION)
TABLE 40: VENEERS MARKET, BY GEOGRAPHY (2022 – 2030, USD MILLION)
TABLE 41: INLAYS & ONLAYS MARKET, BY GEOGRAPHY (2022 – 2030, USD MILLION)
TABLE 42: DENTAL IMPLANTS AND PROSTHETICS MARKET, BY END USER FACILITIES (2022 – 2030, USD MILLION)
TABLE 43: DENTAL HOSPITALS AND CLINICS MARKET, BY GEOGRAPHY (2022 – 2030, USD MILLION)
TABLE 44: LEADING DENTAL SERVICE ORGANIZATION
TABLE 45: DENTAL SERVICE ORGANIZATIONS (DSOS) MARKET, BY GEOGRAPHY (2022 – 2030, USD MILLION)
TABLE 46: OTHER END USER FACILITIES MARKET FOR DENTAL IMPLANTS AND PROSTHETICS, BY GEOGRAPHY (2022 – 2030, USD MILLION)
TABLE 47: DENTAL IMPLANTS AND PROSTHETICS MARKET, BY REGIONS (2022 – 2030, USD MILLION)
TABLE 48: DENTAL IMPLANTS MARKET, BY REGIONS (2022 – 2030, USD MILLION)
TABLE 49: DENTAL PROSTHETICS MARKET, BY REGIONS (2022 – 2030, USD MILLION)
TABLE 50: NORTH AMERICA: DENTAL IMPLANTS AND PROSTHETICS MARKET, BY COUNTRY (2022 – 2030, USD MILLION)
TABLE 51: NORTH AMERICA: DENTAL IMPLANTS MARKET, BY COUNTRY (2022 – 2030, USD MILLION)
TABLE 52: NORTH AMERICA: DENTAL PROSTHETICS MARKET, BY COUNTRY (2022 – 2030, USD MILLION)
TABLE 53: NORTH AMERICA: DENTAL IMPLANTS AND PROSTHETICS MARKET, BY PRODUCT (2022 – 2030, USD MILLION)
TABLE 54: NORTH AMERICA: DENTAL IMPLANTS MARKET, BY MATERIAL (2022 – 2030, USD MILLION)
TABLE 55: NORTH AMERICA: DENTAL IMPLANTS MARKET, BY DESIGN (2022 – 2030, USD MILLION)
TABLE 56: NORTH AMERICA: DENTAL IMPLANTS MARKET, BY PRICE (2022 – 2030, USD MILLION)
TABLE 57: NORTH AMERICA: DENTAL PROSTHETICS MARKET, BY PRODUCT (2022 – 2030, USD MILLION)
TABLE 58: NORTH AMERICA: DENTAL BRIDGES MARKET, BY TYPE (2022 – 2030, USD MILLION)
TABLE 59: NORTH AMERICA: DENTURES MARKET, BY TYPE (2022 – 2030, USD MILLION)
TABLE 60: NORTH AMERICA: DENTAL IMPLANTS AND PROSTHETICS MARKET, BY END USER FACILITIES (2022 – 2030, USD MILLION)
TABLE 61: KEY INDICATORS INFLUENCING THE US DENTAL IMPLANTS AND PROSTHETICS MARKET
TABLE 62: US: DENTAL IMPLANTS AND PROSTHETICS MARKET, BY PRODUCT (2022 – 2030, USD MILLION)
TABLE 63: US: DENTAL IMPLANTS MARKET, BY MATERIAL (2022 – 2030, USD MILLION)
TABLE 64: US: DENTAL IMPLANTS MARKET, BY DESIGN (2022 – 2030, USD MILLION)
TABLE 65: US: DENTAL IMPLANTS MARKET, BY PRICE (2022 – 2030, USD MILLION)
TABLE 66: US: DENTAL PROSTHETICS MARKET, BY PRODUCT (2022 – 2030, USD MILLION)
TABLE 67: US: DENTAL BRIDGES MARKET, BY TYPE (2022 – 2030, USD MILLION)
TABLE 68: US: DENTURES MARKET, BY TYPE (2022 – 2030, USD MILLION)
TABLE 69: US: DENTAL IMPLANTS AND PROSTHETICS MARKET, BY END USER FACILITIES (2022 – 2030, USD MILLION)
TABLE 70: KEY INDICATORS INFLUENCING THE CANADA DENTAL IMPLANTS AND PROSTHETICS MARKET
TABLE 71: CANADA: DENTAL IMPLANTS AND PROSTHETICS MARKET, BY PRODUCT (2022 – 2030, USD MILLION)
TABLE 72: CANADA: DENTAL IMPLANTS MARKET, BY MATERIAL (2022 – 2030, USD MILLION)
TABLE 73: CANADA: DENTAL IMPLANTS MARKET, BY DESIGN (2022 – 2030, USD MILLION)
TABLE 74: CANADA: DENTAL IMPLANTS MARKET, BY PRICE (2022 – 2030, USD MILLION)
TABLE 75: CANADA: DENTAL PROSTHETICS MARKET, BY PRODUCT (2022 – 2030, USD MILLION)
TABLE 76: CANADA: DENTAL BRIDGES MARKET, BY TYPE (2022 – 2030, USD MILLION)
TABLE 77: CANADA: DENTURES MARKET, BY TYPE (2022 – 2030, USD MILLION)
TABLE 78: CANADA: DENTAL IMPLANTS AND PROSTHETICS MARKET, BY END USER FACILITIES (2022 – 2030, USD MILLION)
TABLE 79: EUROPE: DENTAL IMPLANTS AND PROSTHETICS MARKET, BY COUNTRY (2022 – 2030, USD MILLION)
TABLE 80: EUROPE: DENTAL IMPLANTS MARKET, BY COUNTRY (2022 – 2030, USD MILLION)
TABLE 81: EUROPE: DENTAL PROSTHETICS MARKET, BY COUNTRY (2022 – 2030, USD MILLION)
TABLE 82: EUROPE: DENTAL IMPLANTS AND PROSTHETICS MARKET, BY PRODUCT (2022 – 2030, USD MILLION)
TABLE 83: EUROPE: DENTAL IMPLANTS MARKET, BY MATERIAL (2022 – 2030, USD MILLION)
TABLE 84: EUROPE: DENTAL IMPLANTS MARKET, BY DESIGN (2022 – 2030, USD MILLION)
TABLE 85: EUROPE: DENTAL IMPLANTS MARKET, BY PRICE (2022 – 2030, USD MILLION)
TABLE 86: EUROPE: DENTAL PROSTHETICS MARKET, BY PRODUCT (2022 – 2030, USD MILLION)
TABLE 87: EUROPE: DENTAL BRIDGES MARKET, BY TYPE (2022 – 2030, USD MILLION)
TABLE 88: EUROPE: DENTURES MARKET, BY TYPE (2022 – 2030, USD MILLION)
TABLE 89: EUROPE: DENTAL IMPLANTS AND PROSTHETICS MARKET, BY END USER FACILITIES (2022 – 2030, USD MILLION)
TABLE 90: KEY INDICATORS INFLUENCING THE GERMANY DENTAL IMPLANTS AND PROSTHETICS MARKET
TABLE 91: GERMANY: DENTAL IMPLANTS AND PROSTHETICS MARKET, BY PRODUCT (2022 – 2030, USD MILLION)
TABLE 92: GERMANY: DENTAL IMPLANTS MARKET, BY MATERIAL (2022 – 2030, USD MILLION)
TABLE 93: GERMANY: DENTAL IMPLANTS MARKET, BY DESIGN (2022 – 2030, USD MILLION)
TABLE 94: GERMANY: DENTAL IMPLANTS MARKET, BY PRICE (2022 – 2030, USD MILLION)
TABLE 95: GERMANY: DENTAL PROSTHETICS MARKET, BY PRODUCT (2022 – 2030, USD MILLION)
TABLE 96: GERMANY: DENTAL BRIDGES MARKET, BY TYPE (2022 – 2030, USD MILLION)
TABLE 97: GERMANY: DENTURES MARKET, BY TYPE (2022 – 2030, USD MILLION)
TABLE 98: GERMANY: DENTAL IMPLANTS AND PROSTHETICS MARKET, BY END USER FACILITIES (2022 – 2030, USD MILLION)
TABLE 99: KEY INDICATORS INFLUENCING THE UK DENTAL IMPLANTS AND PROSTHETICS MARKET
TABLE 100: UK: DENTAL IMPLANTS AND PROSTHETICS MARKET, BY PRODUCT (2022 – 2030, USD MILLION)
TABLE 101: UK: DENTAL IMPLANTS MARKET, BY MATERIAL (2022 – 2030, USD MILLION)
TABLE 102: UK: DENTAL IMPLANTS MARKET, BY DESIGN (2022 – 2030, USD MILLION)
TABLE 103: UK: DENTAL IMPLANTS MARKET, BY PRICE (2022 – 2030, USD MILLION)
TABLE 104: UK: DENTAL PROSTHETICS MARKET, BY PRODUCT (2022 – 2030, USD MILLION)
TABLE 105: UK: DENTAL BRIDGES MARKET, BY TYPE (2022 – 2030, USD MILLION)
TABLE 106:UK: DENTURES MARKET, BY TYPE (2022 – 2030, USD MILLION)
TABLE 107: UK: DENTAL IMPLANTS AND PROSTHETICS MARKET, BY END USER FACILITIES (2022 – 2030, USD MILLION)
TABLE 108: KEY INDICATORS INFLUENCING THE FRANCE DENTAL IMPLANTS AND PROSTHETICS MARKET
TABLE 109: FRANCE: DENTAL IMPLANTS AND PROSTHETICS MARKET, BY PRODUCT (2022 – 2030, USD MILLION)
TABLE 110: FRANCE: DENTAL IMPLANTS MARKET, BY MATERIAL (2022 – 2030, USD MILLION)
TABLE 111: FRANCE: DENTAL IMPLANTS MARKET, BY DESIGN (2022 – 2030, USD MILLION)
TABLE 112: FRANCE: DENTAL IMPLANTS MARKET, BY PRICE (2022 – 2030, USD MILLION)
TABLE 113: FRANCE: DENTAL PROSTHETICS MARKET, BY PRODUCT (2022 – 2030, USD MILLION)
TABLE 114: FRANCE: DENTAL BRIDGES MARKET, BY TYPE (2022 – 2030, USD MILLION)
TABLE 115: FRANCE: DENTURES MARKET, BY TYPE (2022 – 2030, USD MILLION)
TABLE 116: FRANCE: DENTAL IMPLANTS AND PROSTHETICS MARKET, BY END USER FACILITIES (2022 – 2030, USD MILLION)
TABLE 117: KEY INDICATORS INFLUENCING THE ITALY DENTAL IMPLANTS AND PROSTHETICS MARKET
TABLE 118: ITALY: DENTAL IMPLANTS AND PROSTHETICS MARKET, BY PRODUCT (2022 – 2030, USD MILLION)
TABLE 119: ITALY: DENTAL IMPLANTS MARKET, BY MATERIAL (2022 – 2030, USD MILLION)
TABLE 120: ITALY: DENTAL IMPLANTS MARKET, BY DESIGN (2022 – 2030, USD MILLION)
TABLE 121: ITALY: DENTAL IMPLANTS MARKET, BY PRICE (2022 – 2030, USD MILLION)
TABLE 122: ITALY: DENTAL PROSTHETICS MARKET, BY PRODUCT (2022 – 2030, USD MILLION)
TABLE 123: ITALY: DENTAL BRIDGES MARKET, BY TYPE (2022 – 2030, USD MILLION)
TABLE 124: ITALY: DENTURES MARKET, BY TYPE (2022 – 2030, USD MILLION)
TABLE 125: ITALY: DENTAL IMPLANTS AND PROSTHETICS MARKET, BY END USER FACILITIES (2022 – 2030, USD MILLION)
TABLE 126: KEY INDICATORS INFLUENCING THE SPAIN DENTAL IMPLANTS AND PROSTHETICS MARKET
TABLE 127: SPAIN: DENTAL IMPLANTS AND PROSTHETICS MARKET, BY PRODUCT (2022 – 2030, USD MILLION)
TABLE 128: SPAIN: DENTAL IMPLANTS MARKET, BY MATERIAL (2022 – 2030, USD MILLION)
TABLE 129: SPAIN: DENTAL IMPLANTS MARKET, BY DESIGN (2022 – 2030, USD MILLION)
TABLE 130:SPAIN: DENTAL IMPLANTS MARKET, BY PRICE (2022 – 2030, USD MILLION)
TABLE 131:SPAIN: DENTAL PROSTHETICS MARKET, BY PRODUCT (2022 – 2030, USD MILLION)
TABLE 132: SPAIN: DENTAL BRIDGES MARKET, BY TYPE (2022 – 2030, USD MILLION)
TABLE 133: SPAIN: DENTURES MARKET, BY TYPE (2022 – 2030, USD MILLION)
TABLE 134: SPAIN: DENTAL IMPLANTS AND PROSTHETICS MARKET, BY END USER FACILITIES (2022 – 2030, USD MILLION)
TABLE 135: KEY INDICATORS INFLUENCING THE REST OF EUROPE DENTAL IMPLANTS AND PROSTHETICS MARKET
TABLE 136: REST OF EUROPE: DENTAL IMPLANTS AND PROSTHETICS MARKET, BY PRODUCT (2022 – 2030, USD MILLION)
TABLE 137: REST OF EUROPE: DENTAL IMPLANTS MARKET, BY MATERIAL (2022 – 2030, USD MILLION)
TABLE 138:REST OF EUROPE: DENTAL IMPLANTS MARKET, BY DESIGN (2022 – 2030, USD MILLION)
TABLE 139: REST OF EUROPE: DENTAL IMPLANTS MARKET, BY PRICE (2022 – 2030, USD MILLION)
TABLE 140: REST OF EUROPE: DENTAL PROSTHETICS MARKET, BY PRODUCT (2022 – 2030, USD MILLION)
TABLE 141: REST OF EUROPE: DENTAL BRIDGES MARKET, BY TYPE (2022 – 2030, USD MILLION)
TABLE 142: REST OF EUROPE: DENTURES MARKET, BY TYPE (2022 – 2030, USD MILLION)
TABLE 143: REST OF EUROPE: DENTAL IMPLANTS AND PROSTHETICS MARKET, BY END USER FACILITIES (2022 – 2030, USD MILLION)
TABLE 144: ASIA PACIFIC: DENTAL IMPLANTS AND PROSTHETICS MARKET, BY COUNTRY (2022 – 2030, USD MILLION)
TABLE 145:ASIA PACIFIC: DENTAL IMPLANTS MARKET, BY COUNTRY (2022 – 2030, USD MILLION)
TABLE 146: ASIA PACIFIC: DENTAL PROSTHETICS MARKET, BY COUNTRY (2022 – 2030, USD MILLION)
TABLE 147: ASIA PACIFIC: DENTAL IMPLANTS AND PROSTHETICS MARKET, BY PRODUCT (2022 – 2030, USD MILLION)
TABLE 148: ASIA PACIFIC: DENTAL IMPLANTS MARKET, BY MATERIAL (2022 – 2030, USD MILLION)
TABLE 149: ASIA PACIFIC: DENTAL IMPLANTS MARKET, BY DESIGN (2022 – 2030, USD MILLION)
TABLE 150: ASIA PACIFIC: DENTAL IMPLANTS MARKET, BY PRICE (2022 – 2030, USD MILLION)
TABLE 151: ASIA PACIFIC: DENTAL PROSTHETICS MARKET, BY PRODUCT (2022 – 2030, USD MILLION)
TABLE 152: ASIA PACIFIC: DENTAL BRIDGES MARKET, BY TYPE (2022 – 2030, USD MILLION)
TABLE 153: ASIA PACIFIC: DENTURES MARKET, BY TYPE (2022 – 2030, USD MILLION)
TABLE 154: ASIA PACIFIC: DENTAL IMPLANTS AND PROSTHETICS MARKET, BY END USER FACILITIES (2022 – 2030, USD MILLION)
TABLE 155: KEY INDICATORS INFLUENCING THE CHINA DENTAL IMPLANTS AND PROSTHETICS MARKET
TABLE 156: CHINA: DENTAL IMPLANTS AND PROSTHETICS MARKET, BY PRODUCT (2022 – 2030, USD MILLION)
TABLE 157: CHINA: DENTAL IMPLANTS MARKET, BY MATERIAL (2022 – 2030, USD MILLION)
TABLE 158: CHINA: DENTAL IMPLANTS MARKET, BY DESIGN (2022 – 2030, USD MILLION)
TABLE 159:CHINA: DENTAL IMPLANTS MARKET, BY PRICE (2022 – 2030, USD MILLION)
TABLE 160: CHINA: DENTAL PROSTHETICS MARKET, BY PRODUCT (2022 – 2030, USD MILLION)
TABLE 161: CHINA: DENTAL BRIDGES MARKET, BY TYPE (2022 – 2030, USD MILLION)
TABLE 162: CHINA: DENTURES MARKET, BY TYPE (2022 – 2030, USD MILLION)
TABLE 163: CHINA: DENTAL IMPLANTS AND PROSTHETICS MARKET, BY END USER FACILITIES (2022 – 2030, USD MILLION)
TABLE 164: KEY INDICATORS INFLUENCING THE JAPAN DENTAL IMPLANTS AND PROSTHETICS MARKET
TABLE 165:JAPAN: DENTAL IMPLANTS AND PROSTHETICS MARKET, BY PRODUCT (2022 – 2030, USD MILLION)
TABLE 166: JAPAN: DENTAL IMPLANTS MARKET, BY MATERIAL (2022 – 2030, USD MILLION)
TABLE 167: JAPAN: DENTAL IMPLANTS MARKET, BY DESIGN (2022 – 2030, USD MILLION)
TABLE 168: JAPAN: DENTAL IMPLANTS MARKET, BY PRICE (2022 – 2030, USD MILLION)
TABLE 169: JAPAN: DENTAL PROSTHETICS MARKET, BY PRODUCT (2022 – 2030, USD MILLION)
TABLE 170: JAPAN: DENTAL BRIDGES MARKET, BY TYPE (2022 – 2030, USD MILLION)
TABLE 171: JAPAN: DENTURES MARKET, BY TYPE (2022 – 2030, USD MILLION)
TABLE 172: JAPAN: DENTAL IMPLANTS AND PROSTHETICS MARKET, BY END USER FACILITIES (2022 – 2030, USD MILLION)
TABLE 173: KEY INDICATORS INFLUENCING THE INDIA DENTAL IMPLANTS AND PROSTHETICS MARKET
TABLE 174: INDIA: DENTAL IMPLANTS AND PROSTHETICS MARKET, BY PRODUCT (2022 – 2030, USD MILLION)
TABLE 175: INDIA: DENTAL IMPLANTS MARKET, BY MATERIAL (2022 – 2030, USD MILLION)
TABLE 176: INDIA: DENTAL IMPLANTS MARKET, BY DESIGN (2022 – 2030, USD MILLION)
TABLE 177: INDIA: DENTAL IMPLANTS MARKET, BY PRICE (2022 – 2030, USD MILLION)
TABLE 178: INDIA: DENTAL PROSTHETICS MARKET, BY PRODUCT (2022 – 2030, USD MILLION)
TABLE 179: INDIA: DENTAL BRIDGES MARKET, BY TYPE (2022 – 2030, USD MILLION)
TABLE 180:INDIA: DENTURES MARKET, BY TYPE (2022 – 2030, USD MILLION)
TABLE 181:INDIA: DENTAL IMPLANTS AND PROSTHETICS MARKET, BY END USER FACILITIES (2022 – 2030, USD MILLION)
TABLE 182:KEY INDICATORS INFLUENCING THE SOUTH KOREA DENTAL IMPLANTS AND PROSTHETICS MARKET
TABLE 183:SOUTH KOREA: DENTAL IMPLANTS AND PROSTHETICS MARKET, BY PRODUCT (2022 – 2030, USD MILLION)
TABLE 184:SOUTH KOREA: DENTAL IMPLANTS MARKET, BY MATERIAL (2022 – 2030, USD MILLION)
TABLE 185:SOUTH KOREA: DENTAL IMPLANTS MARKET, BY DESIGN (2022 – 2030, USD MILLION)
TABLE 186:SOUTH KOREA: DENTAL IMPLANTS MARKET, BY PRICE (2022 – 2030, USD MILLION)
TABLE 187: SOUTH KOREA: DENTAL PROSTHETICS MARKET, BY PRODUCT (2022 – 2030, USD MILLION)
TABLE 188: SOUTH KOREA: DENTAL BRIDGES MARKET, BY TYPE (2022 – 2030, USD MILLION)
TABLE 189: SOUTH KOREA: DENTURES MARKET, BY TYPE (2022 – 2030, USD MILLION)
TABLE 190: SOUTH KOREA: DENTAL IMPLANTS AND PROSTHETICS MARKET, BY END USER FACILITIES (2022 – 2030, USD MILLION)
TABLE 191: KEY INDICATORS INFLUENCING THE AUSTRALIA & NEW ZEALAND DENTAL IMPLANTS AND PROSTHETICS MARKET
TABLE 192: AUSTRALIA & NEW ZEALAND: DENTAL IMPLANTS AND PROSTHETICS MARKET, BY PRODUCT (2022 – 2030, USD MILLION)
TABLE 193: AUSTRALIA & NEW ZEALAND: DENTAL IMPLANTS MARKET, BY MATERIAL (2022 – 2030, USD MILLION)
TABLE 194: AUSTRALIA & NEW ZEALAND: DENTAL IMPLANTS MARKET, BY DESIGN (2022 – 2030, USD MILLION)
TABLE 195: AUSTRALIA & NEW ZEALAND: DENTAL IMPLANTS MARKET, BY PRICE (2022 – 2030, USD MILLION)
TABLE 196: AUSTRALIA & NEW ZEALAND: DENTAL PROSTHETICS MARKET, BY PRODUCT (2022 – 2030, USD MILLION)
TABLE 197: AUSTRALIA & NEW ZEALAND: DENTAL BRIDGES MARKET, BY TYPE (2022 – 2030, USD MILLION)
TABLE 198: AUSTRALIA & NEW ZEALAND: DENTURES MARKET, BY TYPE (2022 – 2030, USD MILLION)
TABLE 199: AUSTRALIA & NEW ZEALAND: DENTAL IMPLANTS AND PROSTHETICS MARKET, BY END USER FACILITIES (2022 – 2030, USD MILLION)
TABLE 200: REST OF ASIA PACIFIC: DENTAL IMPLANTS AND PROSTHETICS MARKET, BY PRODUCT (2022 – 2030, USD MILLION)
TABLE 201:REST OF ASIA PACIFIC: DENTAL IMPLANTS MARKET, BY MATERIAL (2022 – 2030, USD MILLION)
TABLE 202: REST OF ASIA PACIFIC: DENTAL IMPLANTS MARKET, BY DESIGN (2022 – 2030, USD MILLION)
TABLE 203:REST OF ASIA PACIFIC: DENTAL IMPLANTS MARKET, BY PRICE (2022 – 2030, USD MILLION)
TABLE 204: REST OF ASIA PACIFIC: DENTAL PROSTHETICS MARKET, BY PRODUCT (2022 – 2030, USD MILLION)
TABLE 205: REST OF ASIA PACIFIC: DENTAL BRIDGES MARKET, BY TYPE (2022 – 2030, USD MILLION)
TABLE 206: REST OF ASIA PACIFIC: DENTURES MARKET, BY TYPE (2022 – 2030, USD MILLION)
TABLE 207: REST OF ASIA PACIFIC: DENTAL IMPLANTS AND PROSTHETICS MARKET, BY END USER FACILITIES (2022 – 2030, USD MILLION)
TABLE 208: KEY INDICATORS INFLUENCING THE BRAZIL DENTAL IMPLANTS AND PROSTHETICS MARKET
TABLE 209: KEY INDICATORS INFLUENCING THE MEXICO DENTAL IMPLANTS AND PROSTHETICS MARKET
TABLE 210:LATIN AMERICA: DENTAL IMPLANTS AND PROSTHETICS MARKET, BY PRODUCT (2022 – 2030, USD MILLION)
TABLE 211: LATIN AMERICA: DENTAL IMPLANTS MARKET, BY MATERIAL (2022 – 2030, USD MILLION)
TABLE 212:LATIN AMERICA: DENTAL IMPLANTS MARKET, BY DESIGN (2022 – 2030, USD MILLION)
TABLE 213: LATIN AMERICA: DENTAL IMPLANTS MARKET, BY PRICE (2022 – 2030, USD MILLION)
TABLE 214: LATIN AMERICA: DENTAL PROSTHETICS MARKET, BY PRODUCT (2022 – 2030, USD MILLION)
TABLE 215:LATIN AMERICA: DENTAL BRIDGES MARKET, BY TYPE (2022 – 2030, USD MILLION)
TABLE 216: LATIN AMERICA: DENTURES MARKET, BY TYPE (2022 – 2030, USD MILLION)
TABLE 217: LATIN AMERICA: DENTAL IMPLANTS AND PROSTHETICS MARKET, BY END USER FACILITIES (2022 – 2030, USD MILLION)
TABLE 218: MIDDLE EAST & AFRICA: DENTAL IMPLANTS AND PROSTHETICS MARKET, BY PRODUCT (2022 – 2030, USD MILLION)
TABLE 219: MIDDLE EAST & AFRICA: DENTAL IMPLANTS MARKET, BY MATERIAL (2022 – 2030, USD MILLION)
TABLE 220: MIDDLE EAST & AFRICA: DENTAL IMPLANTS MARKET, BY DESIGN (2022 – 2030, USD MILLION)
TABLE 221: MIDDLE EAST & AFRICA: DENTAL IMPLANTS MARKET, BY PRICE (2022 – 2030, USD MILLION)
TABLE 222: MIDDLE EAST & AFRICA: DENTAL PROSTHETICS MARKET, BY PRODUCT (2022 – 2030, USD MILLION)
TABLE 223: MIDDLE EAST & AFRICA: DENTAL BRIDGES MARKET, BY TYPE (2022 – 2030, USD MILLION)
TABLE 224: MIDDLE EAST & AFRICA: DENTURES MARKET, BY TYPE (2022 – 2030, USD MILLION)
TABLE 225: MIDDLE EAST & AFRICA: DENTAL IMPLANTS AND PROSTHETICS MARKET, BY END USER FACILITIES (2022 – 2030, USD MILLION)
TABLE 226: DENTAL IMPLANTS AND PROSTHETICS MARKET: PRODUCT LAUNCHES (JANUARY 2021 – JULY 2024)
TABLE 227: DENTAL IMPLANTS AND PROSTHETICS MARKET: INORGANIC GROWTH STRATEGIES (JANUARY 2021 – JULY 2024)
TABLE 228: OVERALL FOOTPRINT ANALYSIS FOR KEY PLAYERS IN DENTAL IMPLANTS MARKET
TABLE 229: MATERIAL FOOTPRINT ANALYSIS FOR KEY PLAYERS IN DENTAL IMPLANTS MARKET
TABLE 230: DESIGN FOOTPRINT ANALYSIS FOR KEY PLAYERS IN DENTAL IMPLANTS MARKET
TABLE 231: PRICE FOOTPRINT ANALYSIS FOR KEY PLAYERS IN DENTAL IMPLANTS MARKET
TABLE 232: REGIONAL FOOTPRINT ANALYSIS FOR KEY PLAYERS IN DENTAL IMPLANTS MARKET
The global market for dental implants and prosthetics was valued at approximately USD 11.5 billion in 2023, and is projected to increase to USD 12.1 billion in 2025.
The global dental implants and prosthetics market is anticipated to grow at an annual growth rate of 5.3% from 2024 to 2030 to reach USD 16.5 billion, by 2030.
The major end-users in the dental implants and prosthetics market include Dental hospitals & clinics, Dental service organizations, Other end user facilities. Dental hospitals & clinics remained the significant holder of end user market share, this can be attributed to their ability to manage and dispense complex procedures and insertations.
Leading players within the dental implants and prosthetics market are Institut Straumann AG (Switzerland), Dentsply Sirona Inc. (US), Envista Holdings Corporation (US), ZimView Inc. (US), BioHorizons (US)
The market is consolidated at top, comprising 3-5 key players with them holding almost 50% of the market, while it remains lightly fragmented at the lower levels, with numerous small and mid-sized companies operating at regional and national level.
© Copyright 2024 – Wissen Research All Rights Reserved.