Myasthenia gravis (MG) has a history dating back to ancient times, with its symptoms documented as early as the 17th century. However, it wasn’t until the late 19th and early 20th centuries that more extensive clinical observations and research began. The term “myasthenia gravis” itself was coined in the late 19th century by Sir Thomas Willis, an English physician.
Early treatments for MG included the use of various medications, including atropine and strychnine, which had limited success in alleviating symptoms. The introduction of cholinesterase inhibitors in the mid-20th century marked a significant breakthrough in MG treatment. Today, a range of therapeutic options is available, offering improved outcomes and quality of life for MG patients.
Symptoms:
Myasthenia gravis is characterized by muscle weakness, with common symptoms including ocular myasthenia, eyelid drooping (ptosis), double vision (diplopia), facial muscle weakness, difficulty swallowing, shortness of breath, impaired speech (dysarthria), and muscle weakness in the limbs and neck. The degree of muscle weakness can vary widely among individuals.
Treatment Options:
Managing MG involves avoiding triggers like exhaustion, stress, infections, certain medications, or surgery. Patients should maintain open communication with their healthcare providers for ongoing symptom management and adjustments to treatment plans. Timely diagnosis and tailored treatments have significantly improved the prognosis and quality of life for individuals living with MG.
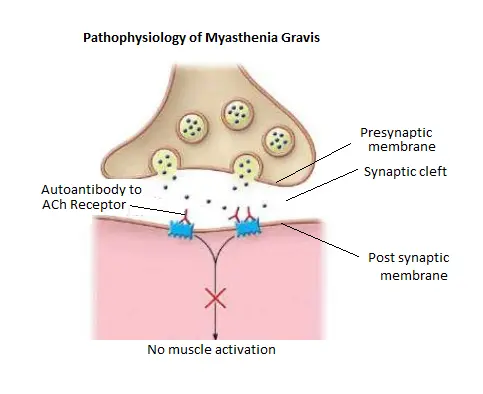
Credits: Pathophysiology of Myasthenia Gravis
(https://www.rcemlearning.co.uk/reference/myasthenia-gravis/#1629466027921-153db447-fb06)
In order to attain a comprehensive understanding of the competitive landscape within the field of Myasthenia Gravis (MG), it is crucial to gather insights into the current research initiatives and developmental pipeline. This knowledge is instrumental in strategically positioning treatments within the market for the near to medium-long term.
Market Landscape: Myasthenia Gravis: Example Illustration: Distribution by Pipeline Candidates
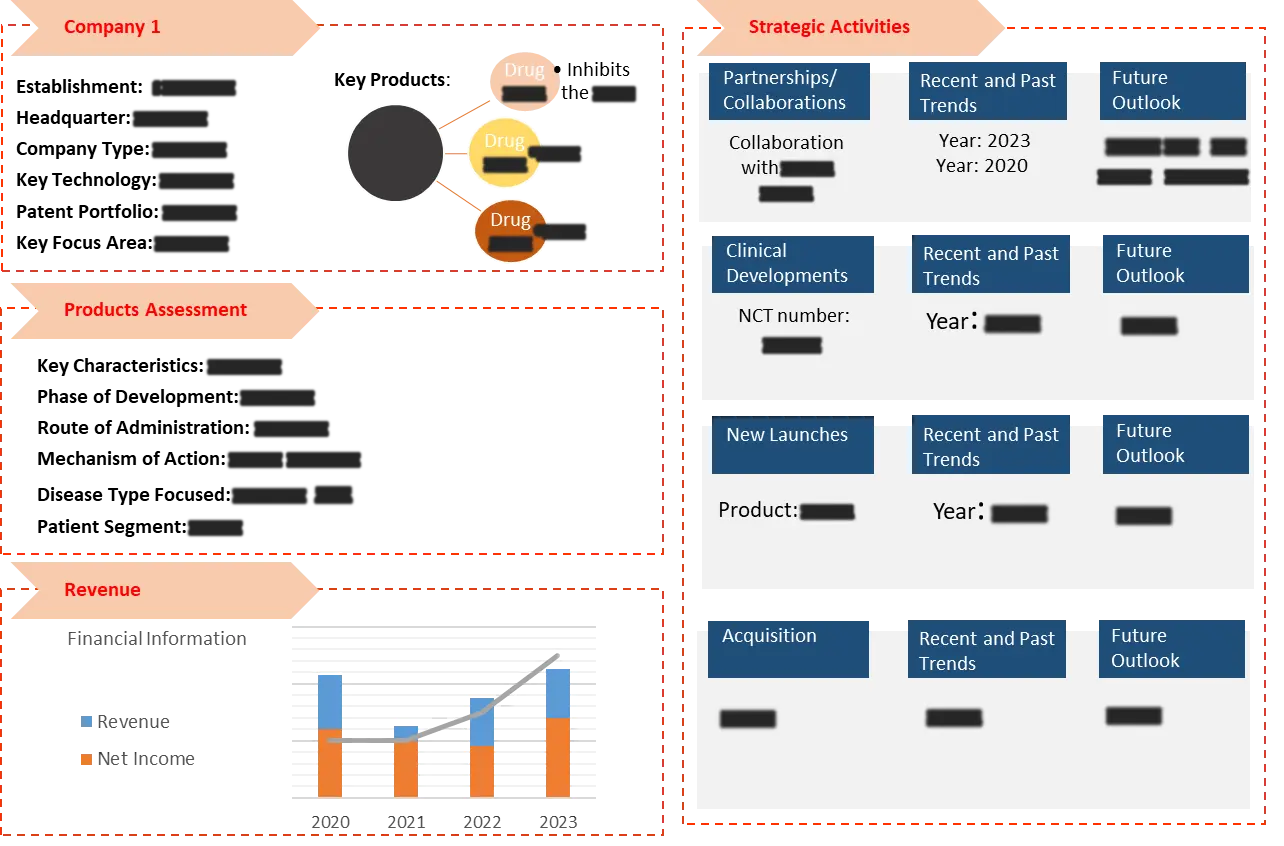
Presented here is the active engagement of stakeholders in shaping treatments for Myasthenia Gravis (MG), encompassing aspects such as financial factors, product offerings, and recent advancements.

Analyzing patents offers valuable insights into groundbreaking innovations and emerging technologies within the realm of Myasthenia Gravis (MG). This deepens our comprehension of novel methodologies for advanced therapies.
Patent chart 1: Current legal status

Patent chart 2: Geographic coverage
Patent chart 3: Annual application trend of the technology
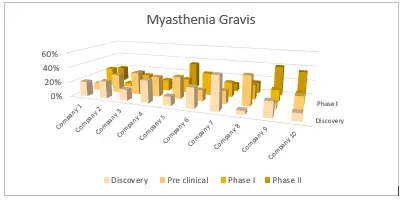
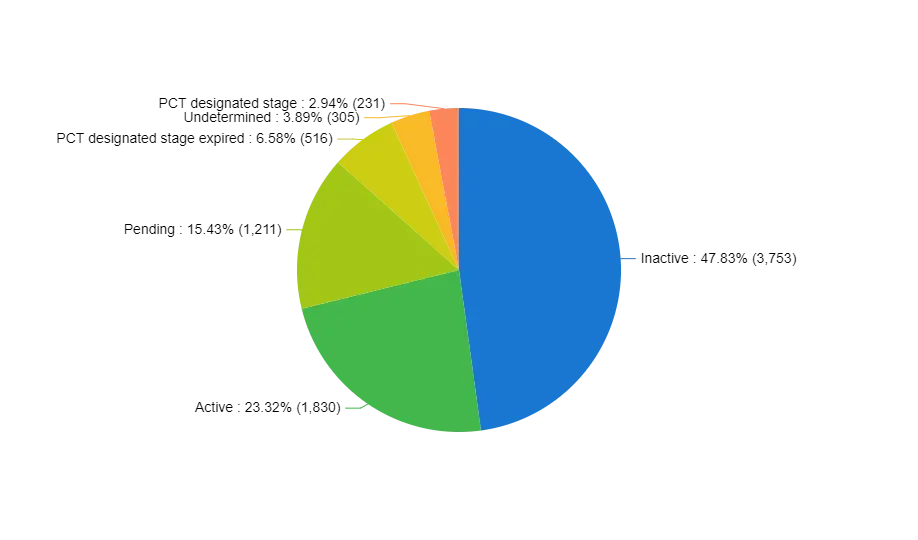
Over the last five years, multiple drugs and therapies have been subjected to evaluation in registered clinical trials across diverse regions, advancing into later stages of development for Myasthenia Gravis (MG).
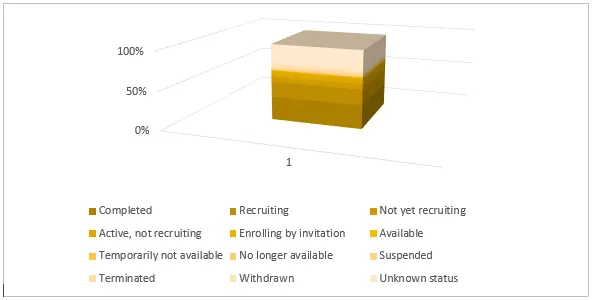
Example illustration 2: Distribution of Clinical Trials by Status
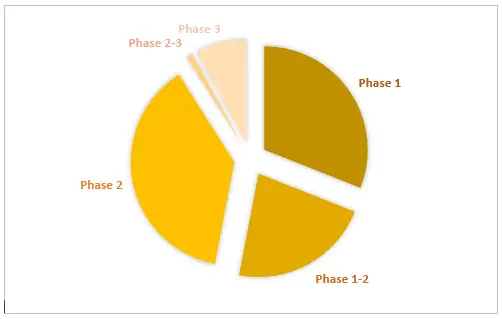
Example illustration 3: Distribution of Clinical Trials by Phase of Development
Market Assessment/Forecast:
Given the support for numerous promising drug candidates and the observation of positive clinical outcomes, the Myasthenia Gravis (MG) market is categorized into various segments, poised for substantial growth in the coming decade.
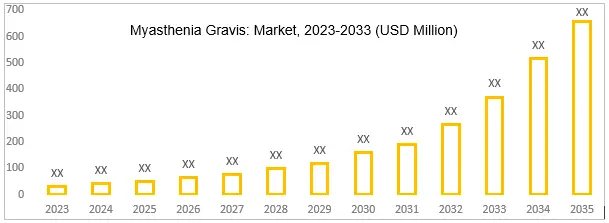
Graph 1: Segmented in terms of the financial growth
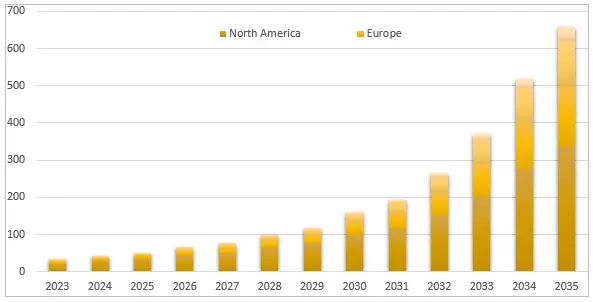
Graph 2: Segmented in terms of the region
Given the presence of numerous companies in the Myasthenia Gravis (MG) domain, potential new entrants may emerge in the market with ambitions to establish their presence and prominence.
Learn About Key Players Shaping Myasthenia Gravis Research.
In order to give the most precise estimations and forecasts, Wissen Research uses an extensive and iterative research approach that is focused on reducing deviation. The company blends top-down and bottom-up methodologies for market segmentation and quantitative estimation. In addition, data triangulation, which examines the market from three separate angles, is a recurrent topic present in all of our research studies. Important components of the approach used for all of our studies include the following:
Preliminary data mining
On a wide scale, unprocessed market data is collected. Continuous data filtering makes sure that only verified and authenticated sources are taken into account. Additionally, data is extracted from a wide range of reports in our repository and from a number of reputable premium databases. We gather information from raw material suppliers, distributors, and purchasers to help with this since understanding the entire value chain is crucial for a thorough understanding of the market.
Surveys, technical symposia, and trade magazines are used to gather information on technical concerns and trends. Technical information focusing on white space and freedom of movement is also obtained from an intellectual property standpoint. Additionally, information on the industry’s drivers, constraints, and pricing patterns is obtained. As a result, a variety of original data are included in the material that is then cross-validated and certified with published sources.
Statistical model
We use simulation models to generate our market projections and estimates. Every study receives a special model that is tailored to it. Data for market dynamics, the technology environment, application development, and pricing patterns are gathered and supplied into the model all at once for analysis. The relative relevance of these factors is investigated, and their impact on the forecast period is assessed, using correlation, regression, and time series analysis. The process of market forecasting combines technological analysis with economic strategies, practical business acumen, and subject expertise.
Econometric models are frequently used for short-term forecasting, but technology market models are typically employed for long-term forecasting. These are based on a confluence of the business environment, regulatory environment, economic projection, and technical landscape. In order to develop global estimates, it is preferable to estimate markets from the bottom up by integrating data from key regional markets. This is required to ensure accuracy and a complete comprehension of the subject. Among the variables taken into account for forecasting are:
Regulations and anticipated developments
We give these criteria weights and use weighted average analysis to assess their market influence in order to calculate the anticipated market growth rate.
Primary research | Secondary research |
· Manufacturers · Technology distributors and wholesalers · End-user surveys · Consumer surveys | · Company reports and publications · Government publications · Independent investigations · Economic and demographic data · Online searches · Literature studies · Research reviews · Case studies · Reference customers |
1. Executive Summary
1.1 Overview of Myasthenia gravis
1.2 Key Findings
1.3 Market Insights and Recommendations
2. Introduction
2.1 Research Background
2.2 Scope and Methodology
2.3 Report Structure
3. Disease Overview
3.1 Definition and Classification of Myasthenia gravis
3.2 Symptoms, Diagnosis, and Clinical Presentation
3.3 Pathophysiology and Genetic Basis
3.4 Epidemiology and Prevalence
3.5 Causes and Risk Factors
3.6 Treatment
4. Market Landscape
4.1 Market Size and Growth Trends, 2023-2033 (USD Million)
4.2 Market Segmentation (By Type, Treatment, etc.)
4.3 Competitive Analysis of Key Players
4.4 Market Drivers and Challenges
5. Patent Analysis
5.1 Overview of Myasthenia gravis Patents
5.2 Top Assignees
5.3 Geography Focus of Top Assignees
5.4 Medications and Drug Classes
5.5 Legal Status
5.6 Geography
5.7 Assignee Segmentation
5.8 Network Analysis of Top Collaborators
5.9 Technology Evolution
5.10 Key Patents
5.11 Patent Trends and Innovations
5.12 Key Players and Patent Portfolio Analysis
6. Diagnostic Approaches and Tools
6.1 Neurological Assessment
6.2 Immunological Testing
6.3 Imaging Techniques
6.4 Other Diagnostic Modalities
7. Clinical Trial Analysis
7.1 Chapter Overview
7.2 Analysis by Trial Registration Year
7.3 Analysis by Phase of Development
7.4 Analysis by Number of Patients Enrolled
7.5 Analysis by Status of Trial
7.6 Analysis by Study Design
7.7 Analysis by Type of Product
7.8 Analysis by Geography
7.9 Analysis by Key Sponsors / Collaborators
8. Treatment Options
8.1 Immunosuppressive Therapy
8.2 Acetylcholinesterase Inhibitors
8.3 Thymectomy
8.4 Emerging Treatment Approaches
8.5 Product Analysis of Treatment Options
9. Market Analysis by Region (USD Million)
9.1 North America
9.2 Europe
9.3 Asia-Pacific
9.4 Latin America
9.5 Middle East and Africa
10. Competitive Landscape
10.1 Company Profiles
10.2 Product Portfolio Analysis
10.3 Recent Developments and Strategies
11. Future Outlook and Market Opportunities
11.1 Advancements in Research and Technology
11.2 Unmet Needs and Potential Market Gaps
11.3 Market Forecast and Growth Opportunities
12. Conclusion
13. Appendix
13.1 Glossary of Terms
13.2 List of Abbreviations
13.3 References
S.no | Key Highlights of Report | |
1. | Patent Analysis | · Top Assignee · Geography focus of top Assignees · Assignee Segmentation · Network analysis of the top collaborating entities in Myasthenia Gravis treatments patent applications · Technology Evolution · Key Patents · Application and Issued Trend · Key technology |
2. | Market analysis | · Current Treatment Options · Emerging Therapies and Research Developments (by product analysis and scientific analysis) · Strategic activities · Therapeutic activity of drugs · Company portfolio |
3. | Clinical Trials | · Analysis of clinical trial through graphical representation · Coverage of treatments from pre-clinical phases till commercialization (also including terminated and completed studies) |
4. | Forecast | · Detailed comprehension of the historic, current and forecasted trend of market by analysis of impact of these treatments on the market |
5. | Key Players | · Detailed profiles of the key players that are engaged in the development of approved drugs · Strategic Activities |
6. | Opportunity Analysis | · Technology evolution based on problem solution · Potential licensees · Geography of suppliers · Treatment trends · Unmet needs · SWOT · Drivers and barriers · Opportunity for new treatment |
7. | KOLs | · A detailed analysis and identification of the key opinion leaders (KOLs), shortlisted based on their contributions |
LIST OF FIGURES
Figure number | Description |
Figure 1 | Terminology of Myasthenia Gravis Over The Years |
Figure 2 | Myasthenia Gravis Treatment– History and Present |
Figure 3 | Projection of Myasthenia Gravis till 2033 in different geographies |
Figure 4 | Technology Categorization Of Drug Delivery Methods For Myasthenia Gravis |
Figure 5 | Recent Technology Trends in Myasthenia Gravis |
Figure 6 | Technology Evolution in Drug Delivery Market of Myasthenia Gravis |
Figure 7 | Geographical Distribution of Patents of Top Assignees |
Figure 8 | Assignee Segmentation (Companies) |
Figure 9 | Assignee Segmentation (Educational Establishment) |
Figure 10 | Patent Based Key Insights Of xx |
Figure 11 | Patent Based Key insights of xx |
Figure 12 | Patent Based Key insights of xx |
Figure 13 | Geographic Distribution of the Universities/Research Organizations Filling Patents On Various Drug Delivery Approaches |
Figure 14 | Key Summary Regarding the Patent Filing On Myasthenia Gravis |
Figure 15 | Product Pipeline of Different Approaches with Companies Name |
Figure 16 | Portfolio for Approved Product |
Figure 17 | Clinical Trials Conducted till Date by Different Companies and Universities |
Figure 18 | Clinical Trials based Key Insights |
Figure 19 | Key Growth Drivers for Myasthenia Gravis Market |
Figure 20 | Restraints for Myasthenia Gravis Market |
Figure 21 | xx Portfolio (Top Player) |
Figure 22 | xx Portfolio (Top Player) |
Figure 23 | xx Portfolio (Top Player) |
Figure 24 | xx Portfolio (Top Player) |
Figure 25 | xx Portfolio (Top Player) |
Figure 26 | xx Portfolio (Start-up) |
Figure 27 | xx Portfolio (Start-up) |
Figure 28 | xx Portfolio (Start-up) |
Figure 29 | Strategic Activities Including Collaboration, Partnerships and Acquisitions |
Figure 30 | Research Methodology for Patent, Selection and Analysis |
Figure 31 | Research Methodology for Scientific Literature, Selection and Analysis |
Figure 32 | Research Methodology for Clinical Trials, Selection and Analysis |
LIST OF GRAPHS
Graph number |
Description |
Graph 1 | Number of people worldwide with Myasthenia Gravis |
Graph 2 | Problem Solution Analysis |
Graph 3 | Top Assignees in Myasthenia Gravis |
Graph 4 | Technology Focus of Top Assignees (IPC-CPC Classes) |
Graph 5 | Top Countries of Origin of Patents |
Graph 6 | New entrants in drug delivery field |
Graph 7 | Legal Status |
Graph 8 | Most Cited Patents |
Graph 9 | Patents with Largest Invention Families |
Graph 10 | Most Claim-Heavy Patents |
Graph 11 | Filing Trends |
Graph 12 | Literature Filling Trend During Time Period (2018 – 2023) |
Graph 13 | Clinical Trial Filing Timeline |
Graph 14 | Recruitment Status of the Clinical Trials Related to the Different Drug Delivery Approaches |
Graph 15 | Clinical Trials Phases with Respect to Specific Drug Delivery Approach |
Graph 16 | Weighted Scores for Top 64 Players According to Benchmarking Criteria |
Graph 17 | Myasthenia Gravis (CAGR: 2023-2033) |
Graph 18 | Myasthenia Gravis Market Share: Distribution by Key Geographical Area, 2023-2033 |
LIST OF TABLES
Table number | Description |
Table 1 | Parameters included and excluded for conducting the analysis |
Table 2 | Technology Classes with Definitions |
Table 3 | Patent Litigation |
Table 4 | Highest Market Valued Patents |
Table 5 | SWOT Analysis of Top 3 Players |
Table 6 | Parameters and their score for Benchmarking |
Table 7 | Weighted scores for top 5 players according to benchmarking criteria |