 Sources: Company Websites, Annual Reports, SEC Filings, Press Releases, Investor Presentation, Paid Database, and Wissen Research Analysis.
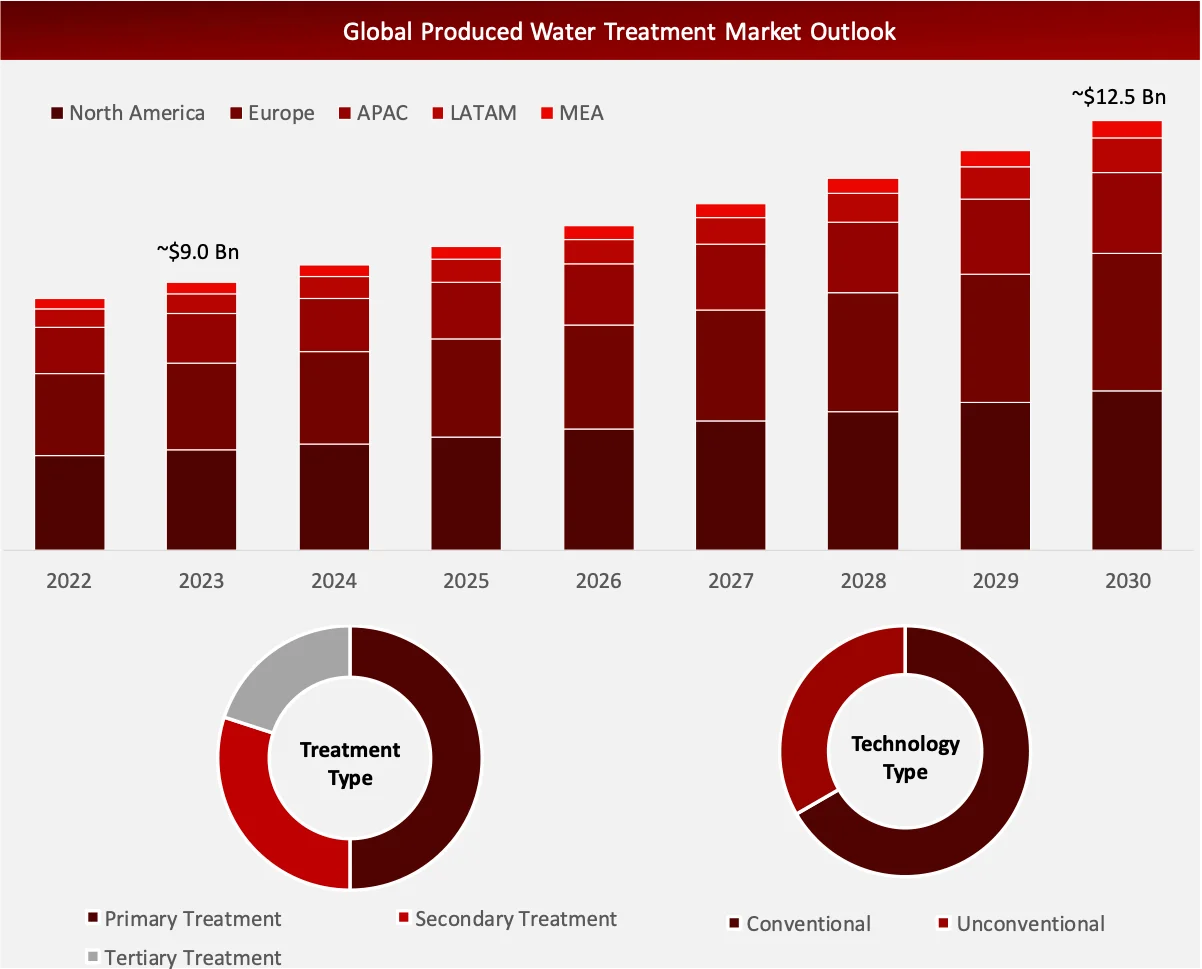
Wissen Research analyses that the global produced water treatment market is estimated at ~USD 9.0 billion in 2023 and is projected to reach ~USD 12.5 billion by 2030, expected to grow at a CAGR of ~6.0% during the forecast period, 2023-2030.
Produced water has high salinity, soluble / non-soluble oil content, suspended solids, dissolved gases, radioactive substances, and dissolved oxygen, which requires a specific treatment process for decontamination. For all major oil producers, the produced water treatment has remained a difficult task. However, the advent of technologies such as, membrane-based systems, have shown a great promise in treating the produced water. It is worth mentioning that currently, the yearly volume of produced water is calculated to be around 77 billion barrels and is projected to increase exponentially in the future, making it a vast majority of waste volume generated by the oil and gas industry. Further, factors such as, increasing stringency in the environmental regulations, rising disposal cost, scarcity of freshwater are enforcing the produced water treatment solution providers to invent new technologies to address the increasing waste volume from oil and gas industry, which is further anticipated to boost the produced water treatment market in the coming years.
Driving Factor: Increasing global demand for oil and gas
The increasing demand for oil and gas across the globe presents ample opportunities for the produced water treatment market. Presently, around 250 million barrels of produced water is generated, which according to the Produced Water Society will increase to 300-600 million barrels per day in the coming years which will significantly boost the growth of the market.
Opportunity: Produced water utilization for industrial and non-industrial purposes
Processed produced water has the potential to be reused in various industrial as well as non-industrial applications for instance, power generation, fire prevention, washing vehicles and equipment, and irrigating non-edible crops. Further, it can also lessen the demand for freshwater resources in regions that have limited water availability. Additionally, produced water can be advantageous for the advancement of clean energy technologies such as, wind turbines and solar panels due to the presence of essential critical minerals and rare elements in it.
Challenge: High treatment costs and stringent regulations
Due to strict regulatory requirements and high treatment cost, produced water treatment has become increasingly difficult. About 80%-90% of generated water is highly saline, resulting into the utilization of highly expensive and advanced treatment technologies. These high capital investment possess significant financial restrictions to many small operators.
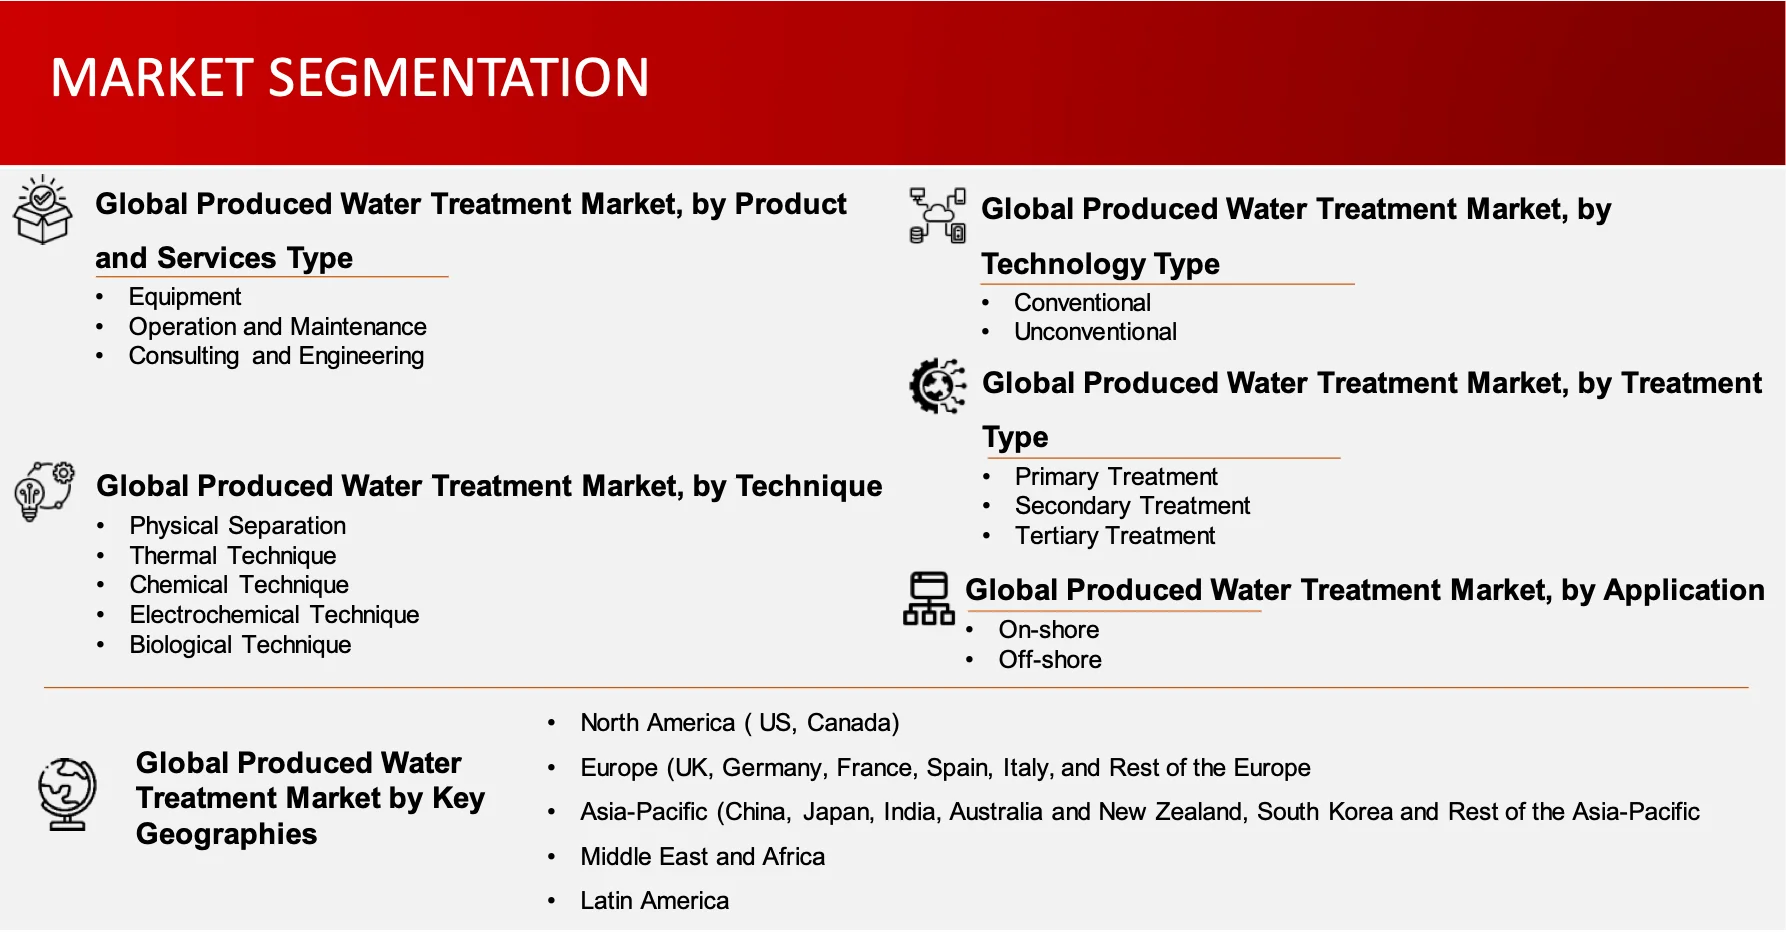
The produced water treatment market report offers information on the latest advancements in the industry, as well as service portfolio analysis, supply chain/value chain analysis, market share, and the effects of localized and domestic players. It also analyzes potential revenue opportunities and changes in market regulations, as well as market size, category market growth, application dominance, product approvals, service launches, geographic expansions, and technological innovations. For an Analyst Brief and other information on the produced water treatment market, get in touch with Wissen Research. Our staff can assist you in making well-informed decisions that will lead to market expansion.
Tertiary treatments are expected to grow at highest CAGR within the produced water treatment market by treatment type
The produced water treatment market is segmented into primary, secondary and tertiary treatments. Tertiary treatments segment is anticipated to growth at the fastest rate during the forecast period. This can be ascribed to the fact that tertiary technique such as, reverse osmosis and others are more suitable for the removal of contaminants. Further, tertiary treatments often involve the use of advanced produced water treatment technologies. Factors such as, increasing investments in advanced treatment technologies are likely to drive the future growth.
On-shore sector captured majority share of current produced water treatment market by application
On-shore and off-shore segments are the key applications where the produced water treatment solution providers are present in. In 2024, on-shore segment captures the largest share. This can be attributed to the higher volume of produced water generation from on-shore operations in comparison to off-shore activities.
North America to dominate the produced water treatment industry and Asia-Pacific to witness the highest growth rate
Currently, North America hold the maximum share owing to the presence of large crude oil reserves in this region. Further, the increasing demand for oil and gas per day results into the rising production of produced water. Due to the stringent environmental regulations in countries like the US and Canada, the efficient treatment of produced water is likely to propel the market. However, Asia-Pacific region is anticipated to grow at highest annualized growth rate during the forecast period.
Major players operating in produced water treatment market are Veolia Environment SA, TechnipFMC Plc., Siemens Energy, SLB, Alderley PLC, Aquatech, CETCO, DuPont Water Solutions., Frames, Schlumberger, among others.
Recent Developments:
Introduction
Market Definition
Produced water is a byproduct of oil and gas exploration process, which requires active treatment to meet environmental regulations and helps in reuse or safe disposal. This produced water has a mixture of injected water, natural formation water, and any other chemicals used in the exploration and drilling process.
 Sources: Company Websites and Wissen Research Analysis.
 Sources: Wissen Research Analysis.
Key Stakeholders
Key objectives of the Study
Research Methodology
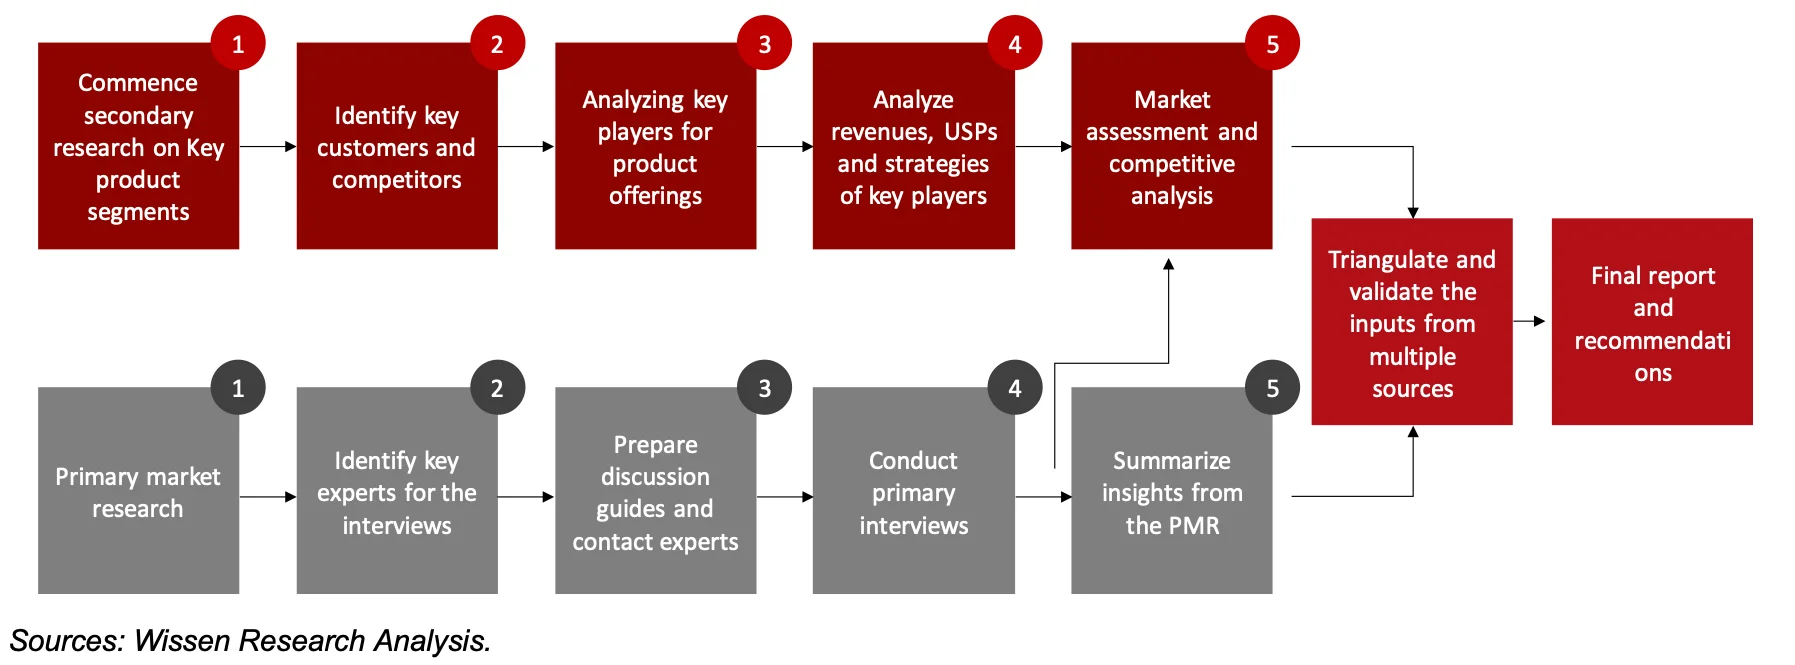
The aim of the study is to examine the key market forces such as drivers, opportunities, restraints, challenges, and strategies of key leaders. To monitor company advancements such as patents granted, product launches, expansions, and collaborations of key players, analyzing their competitive landscape based on various parameters of business and product strategy. Market sizing will be estimated using top-down and bottom-up approaches. Using market breakdown and data triangulation techniques, market sizing of segments and sub-segments will be estimated.
FIGURE: RESEARCH DESIGN
Research Approach
Collecting Secondary Data
The process of collating secondary research data involves the utilization of databases, secondary sources, annual reports, investor presentations, directories, and SEC filings of companies. Secondary research will be utilized to identify and gather information beneficial for the in-depth, technical, market-oriented, and commercial analysis of the produced water treatment market. A database of the key industry leaders will also be compiled using secondary research.
Collecting Primary Data
The primary research data will be conducted after acquiring knowledge about the produced water treatment market scenario through secondary research. A significant number of primary interviews will be conducted with stakeholders from both the demand and supply side (including various industry experts, such as Vice Presidents (VPs), Chief X Officers (CXOs), Directors from business development, marketing and product development teams, product manufacturers) across major countries of Asia-Pacific, Europe, North America, Middle East and Africa, and Latin America. Primary data for this report will be collected through questionnaires, emails, and telephonic interviews.
FIGURE: BREAKDOWN OF PRIMARY INTERVIEWS FROM SUPPLY SIDE
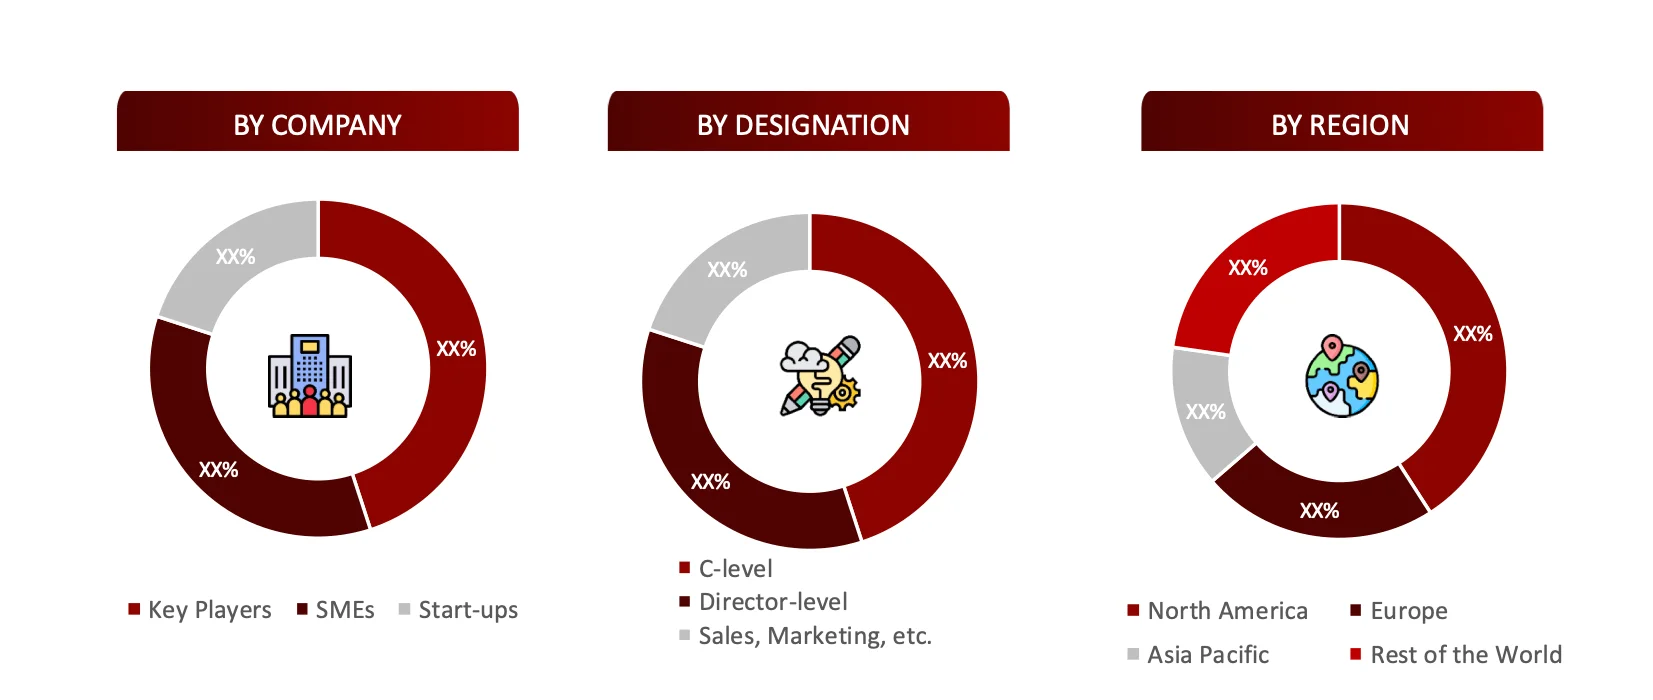
FIGURE: BREAKDOWN OF PRIMARY INTERVIEWS FROM DEMAND SIDE
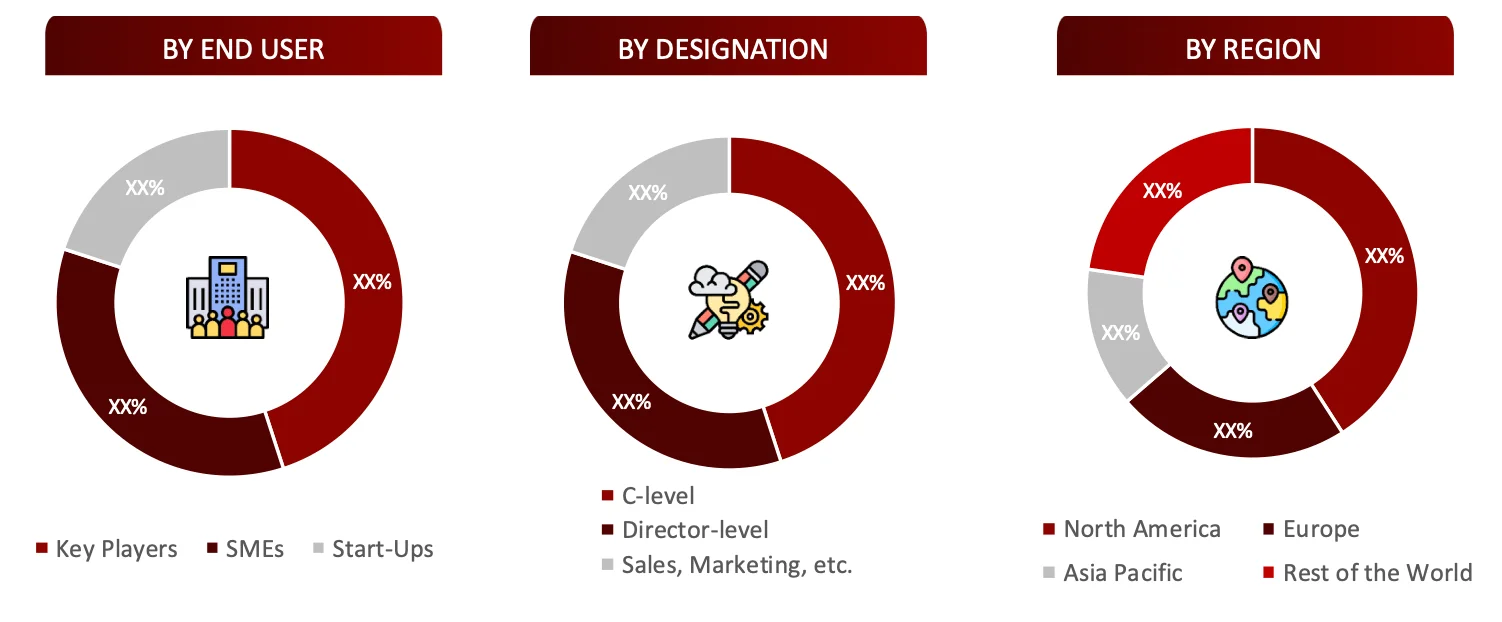
FIGURE: PROPOSED PRIMARY PARTICIPANTS FROM DEMAND AND SUPPLY SIDE
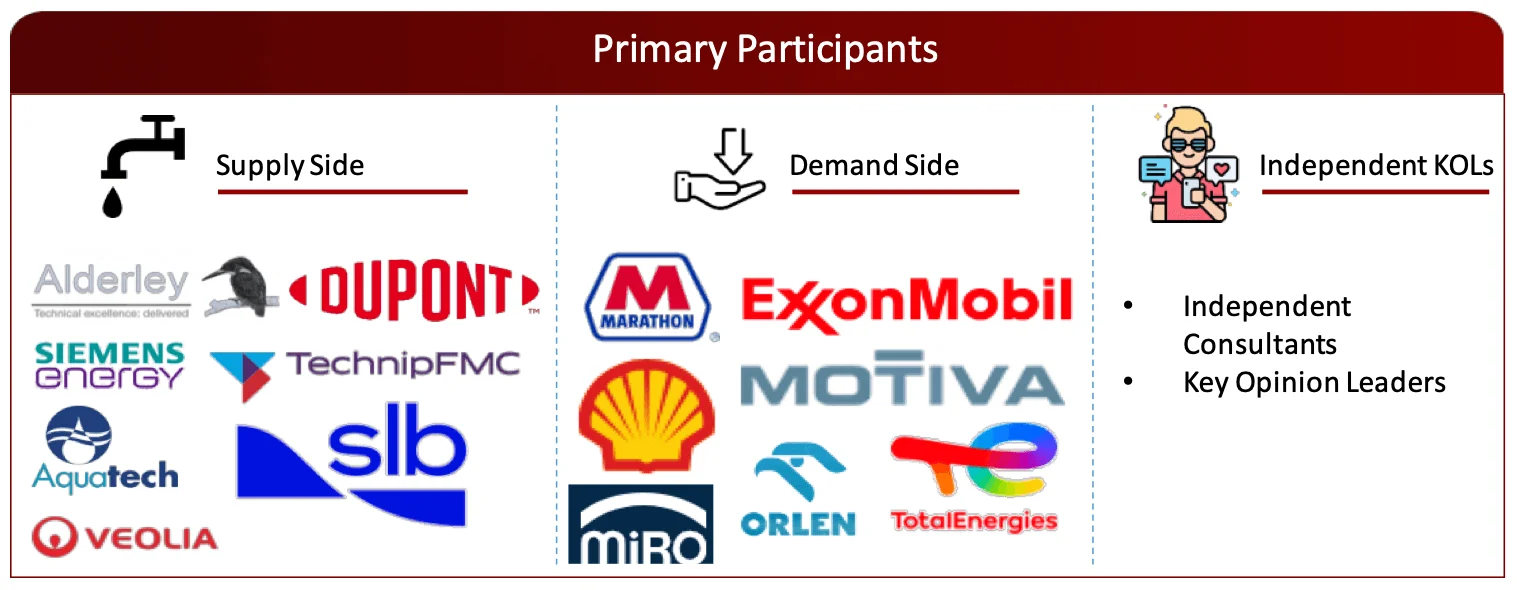
Note: Above mention companies are non-exhaustive.
Market Size Estimation
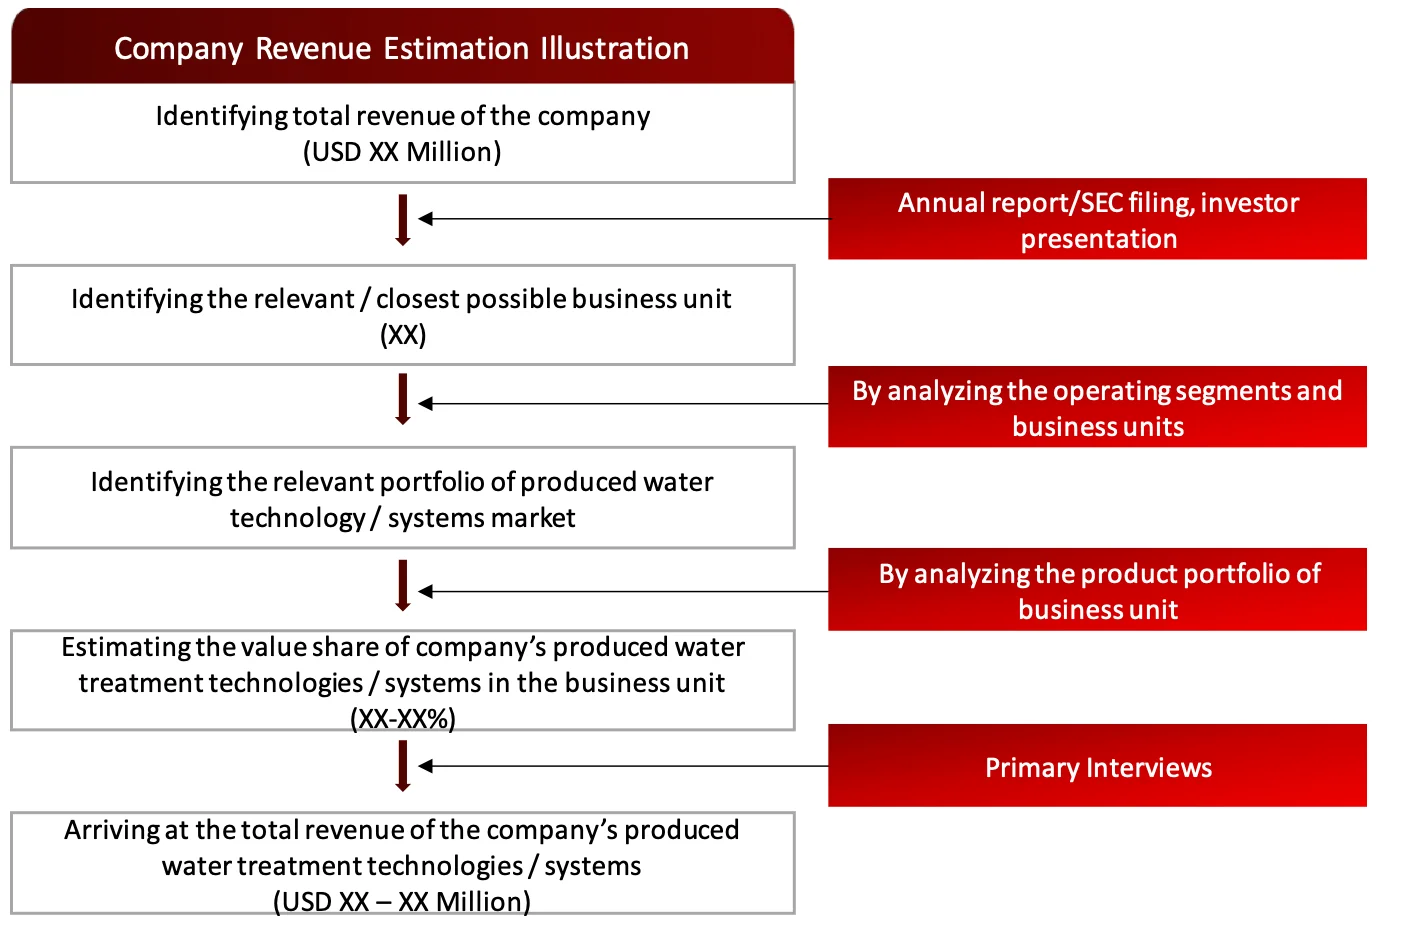
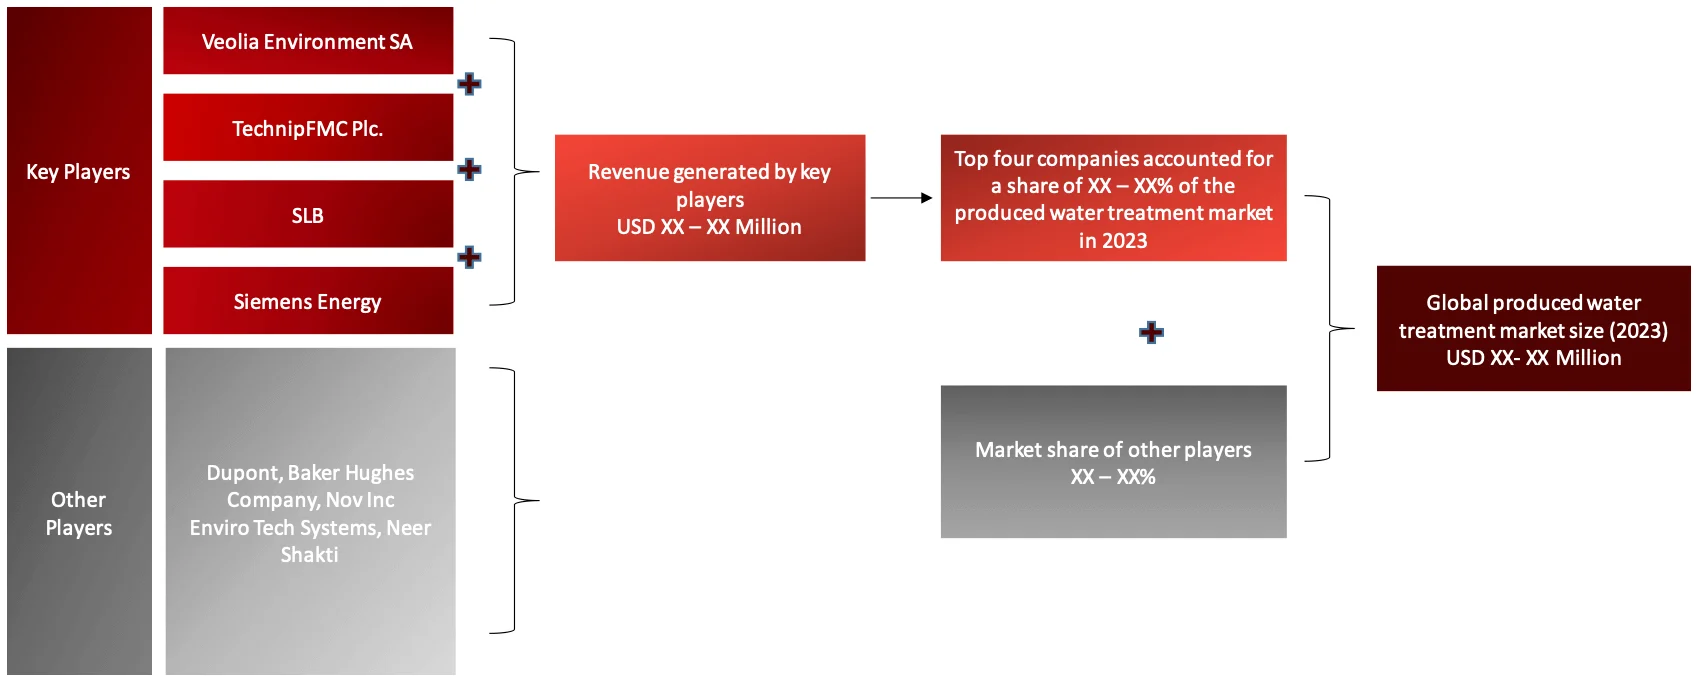
All major manufacturers offering various produced water treatment solutions will be identified at the global / regional level. Revenue mapping will be done for the major players, which will further be extrapolated to arrive at the global market value of each type of segment. The market value of produced water market will also split into various segments and sub segments at the region level based on:
FIGURE: REVENUE MAPPING BY COMPANY (ILLUSTRATION)
 Sources: Company Websites, Annual Reports, SEC Filings, Press Releases, Investor Presentation, Paid Database, and Wissen Research Analysis.
FIGURE: REVENUE SHARE ANALYSIS OF KEY PLAYERS (SUPPLY SIDE)
 Sources: Company Websites, Annual Reports, SEC Filings, Press Releases, Investor Presentation, Paid Database, and Wissen Research Analysis.
FIGURE: MARKET SIZE ESTIMATION TOP-DOWN AND BOTTOM-UP APPROACH
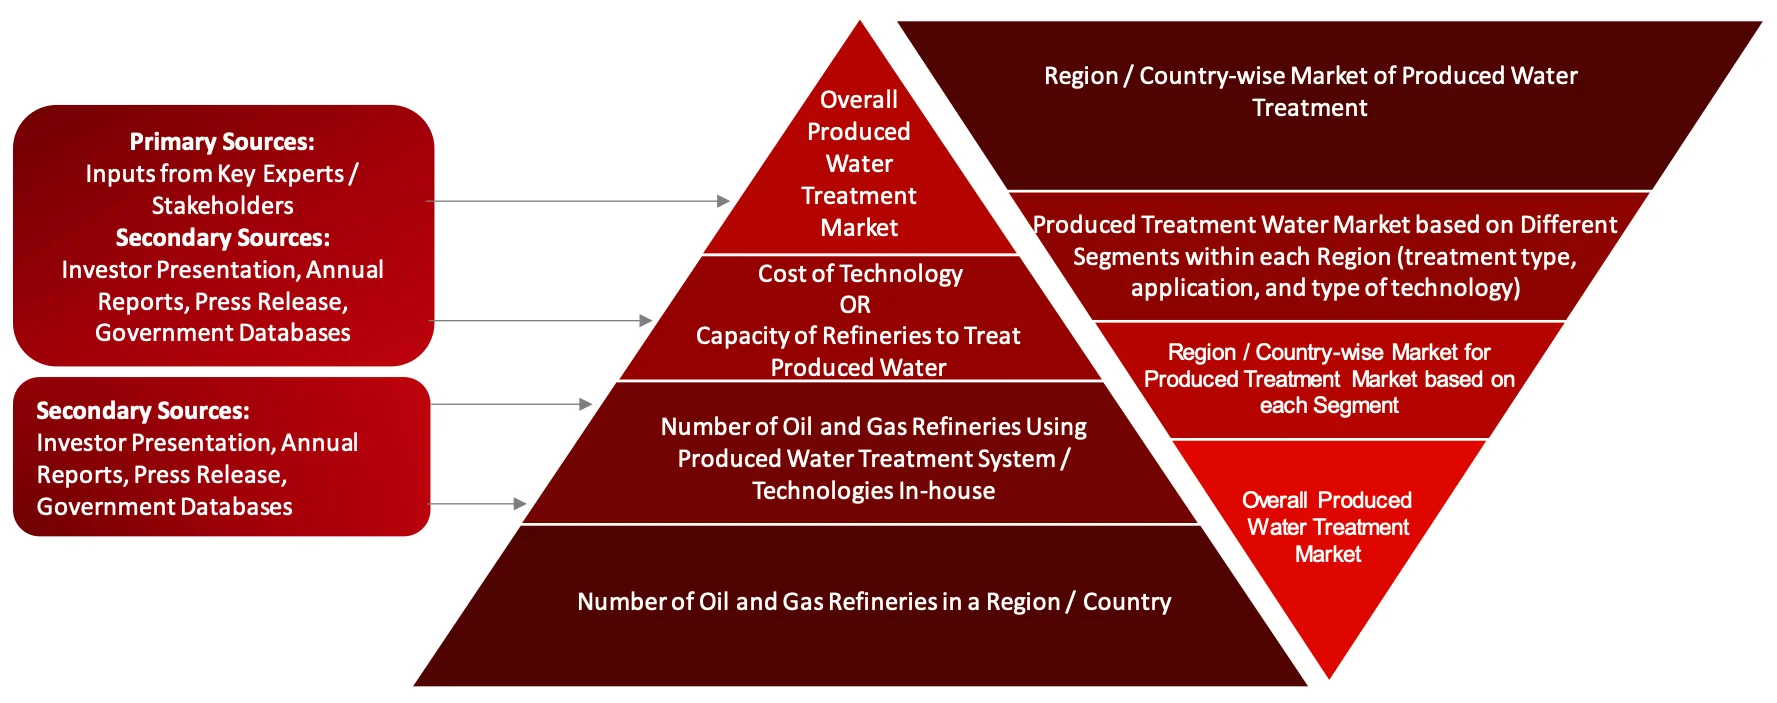 Sources: Company Websites, Annual Reports, SEC Filings, Press Releases, Investor Presentation, Paid Database, and Wissen Research Analysis.
FIGURE: ANALYSIS OF DROCS FOR GROWTH FORECAST
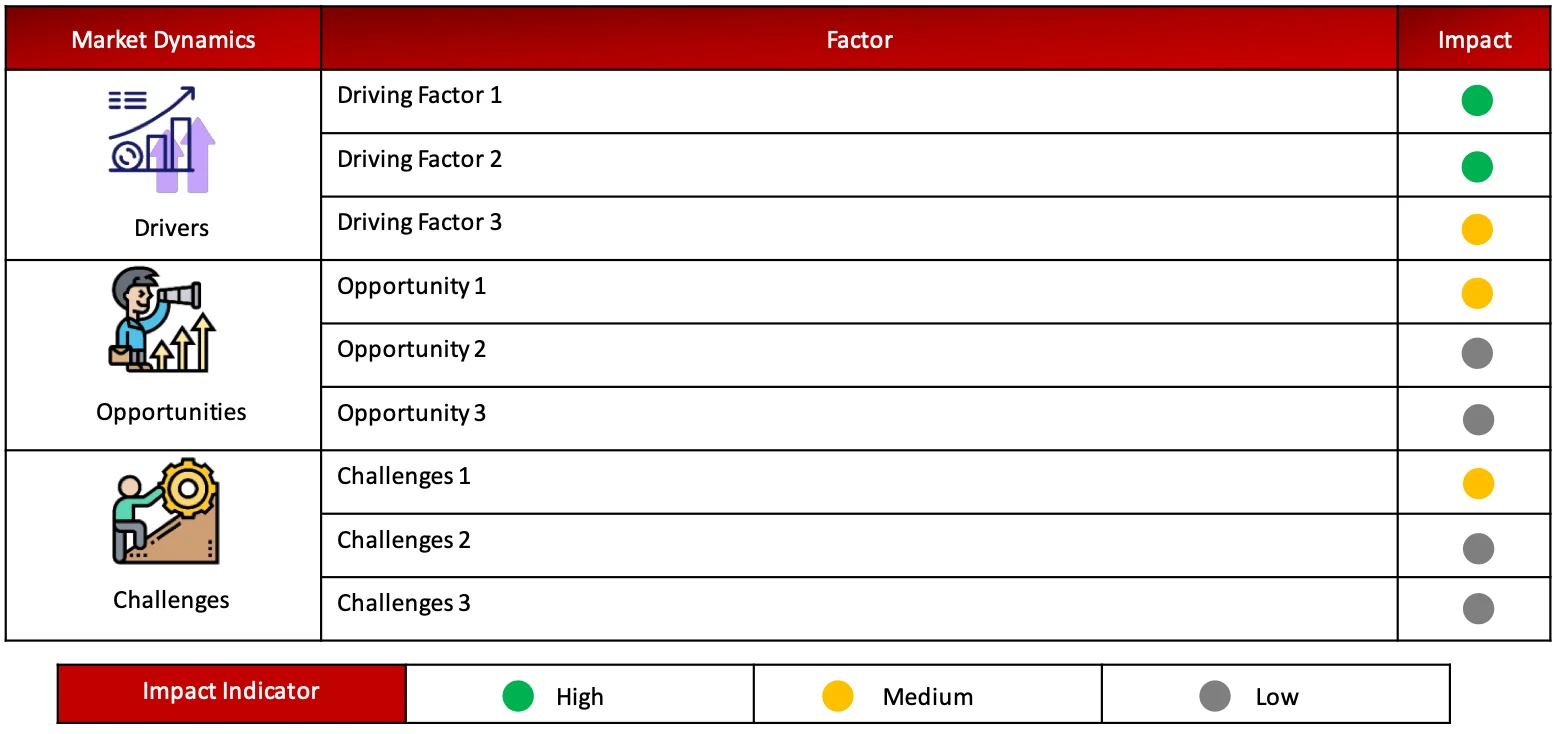
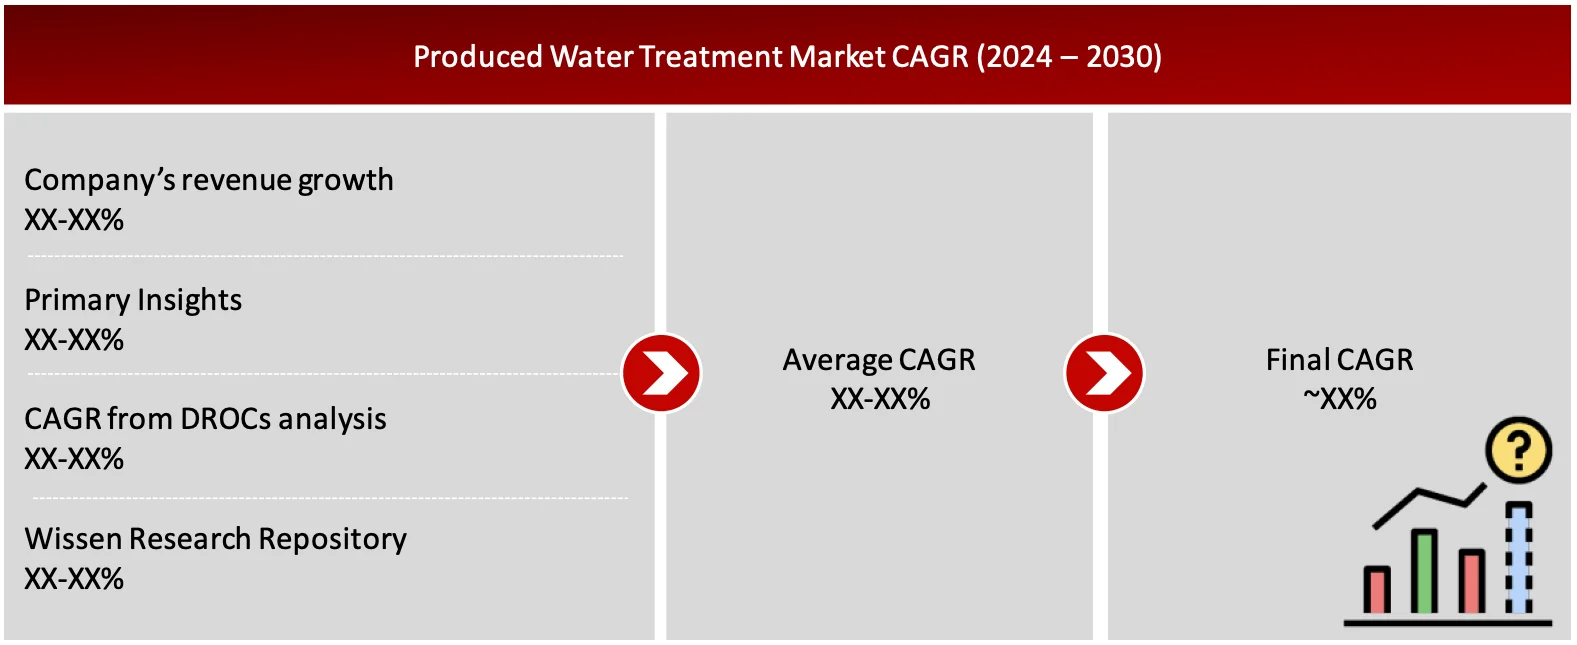
FIGURE: GROWTH FORECAST ANALYSIS UTILIZING MULTIPLE PARAMETERS
Research Design
After arriving at the overall market size-using the market size estimation processes-the market will be split into several segments and sub segment. To complete the overall market engineering process and arrive at the exact statistics of each market segment and sub segment, the data triangulation, and market breakdown procedures will be employed, wherever applicable. The data will be triangulated by studying various factors and trends from both the demand and supply sides in the produced water treatment market.

1. Introduction
1.1 Key Objectives
1.2 Definitions
1.2.1 In Scope
1.2.2 Out of Scope
1.3 Scope of the Report
1.4 Scope Related Limitations
1.5 Key Stakeholders
2. Research Methodology
2.1 Research Approach
2.2 Research Methodology / Design
2.3 Market Sizing Approach
2.3.1 Secondary Research
2.3.2 Primary Research
3. Executive Summary & Premium Content
3.1 Global Market Outlook
3.2 Key Market Findings
4. Market Overview
4.1 Market Dynamics
4.1.1 Drivers/Opportunities
4.1.2 Restraints/Challenges
4.2 End User Perception
4.3 Need Gap
4.4 Supply Chain / Value Chain Analysis
4.5 Industry Trends
4.6 Porter’s Five Forces Analysis
5. Patent Analysis
5.1 Patents Related to Produced Water Treatment Technologies / Systems
5.2 Patent Landscape and Intellectual Property Trends
6. Global Produced Water Treatment Market, by Product and Service Type (2023-2034, USD Million)
6.1 Equipment
6.2 Operations & Maintenance
6.3 Consulting & Engineering
7. Global Produced Water Treatment Market, by Technology Type (2023-2034, USD Million)
7.1 Conventional
7.2 Unconventional
8. Global Produced Water Treatment Market, by Treatment Type (2023-2034, USD Million)
8.1 Primary Treatment
8.2 Secondary Treatment
8.3 Tertiary Treatment
9. Global Produced Water Treatment Market, by Technique (2023-2034, USD Million)
9.1 Physical Separation
9.2 Thermal Technique
9.3 Chemical Technique
9.4 Electrochemical Technique
9.5 Biological Technique
10. Global Produced Water Treatment Market, by Application (2023-2034, USD Million)
10.1 Onshore
10.2 Offshore
11. Global Produced Water Treatment Market, by Region (2023-2030, USD Million)
11.1 North America
11.1.1 US
11.1.2 Canada
11.2 Europe
11.2.1 Germany
11.2.2 France
11.2.3 Spain
11.2.4 Italy
11.2.5 UK
11.2.6 Rest of the Europe
11.3 Asia-Pacific
11.3.1 China
11.3.2 Japan
11.3.3 India
11.3.4 Australia and New Zealand
11.3.5 South Korea
11.3.6 Rest of the Asia-Pacific
11.4 Middle East and Africa
11.5 Latin America
12. Competitive Analysis
12.1 Key Players Footprint Analysis
12.2 Market Share Analysis
12.3 Key Brand Analysis
12.4 Regional Snapshot of Key Players
12.5 R&D Expenditure of Key Players
13. Company Profiles2
13.1 Alderley PLC
13.1.1 Business Overview
13.1.2 Product Portfolio
13.1.3 Financial Snapshot3
13.1.4 Recent Developments
13.1.5 SWOT Analysis
13.2 Aquatech
13.3 Veolia Environment SA
13.4 CETCO
13.5 DuPont Water Solutions
13.6 Frames
13.7 NOV Inc.
13.8 Schlumberger
13.9 Siemens Energy
13.10 TechnipFMC plc
14. Conclusion
15. Appendix
15.1 Industry Speak
15.2 Questionnaire
15.3 Available Custom Work
15.4 Adjacent Studies
15.5 Authors
16. References
Key Notes:
© Copyright 2024 – Wissen Research All Rights Reserved.